I dont know how to go ahead with this The problem statement is "Make a piecewise linear function maker that accepts lists of points as input and has a piecewise linear function as the output".
Lets say for example I have a data sect {1,1,1,0,0,1,1}.
I dont know how to go ahead with this The problem statement is "Make a piecewise linear function maker that accepts lists of points as input and has a piecewise linear function as the output".
Lets say for example I have a data sect {1,1,1,0,0,1,1}.
Let's say you have a list
data = {5, 1, 3, 8};
and you want to create a Piecewise function creator. First, you need to think about how to construct each of the linear functions. E.g. from x=1 to x=2 we need a linear function going from 5 down to 1. From x=2 to x=3 we need a function going from 1 up to 3 and so on. This is simple math, but you can also use Mathematica for this:
Rescale[x, {pos, pos + 1}, {y1, y2}] // FullSimplify
(* (1 + pos - x) y1 + (-pos + x) y2 *)
This is the expression which interpolates the x-range from pos to pos+1 where y1 is its starting value and y2 the value at the right end. For our piecewise-creator we need to fill this expression for all adjacent pairs
{{5,1},{1,3},{3,8}}
The above structure can easily be created with the help of Partition. The only thing that's left is a function which takes two values and inserts them into our linear function expression. Putting everything together gives our piecewise-function-creator
createPiecewise[l_List] := Piecewise[MapIndexed[
   With[{pos = First[#2], y1 = First[#], y2 = Last[#]},
     {y1 (1 + pos - x) + y2 (x - pos), pos <= x < pos + 1}] &,
   Partition[l, 2, 1]]
  ]
Testing it with our data and we get
Now you can work with it or plot it
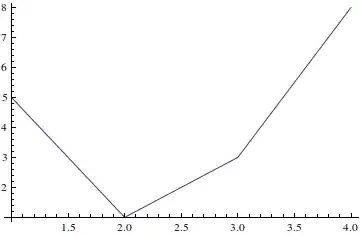
Plot[createPiecewise[data], {x, 1, 4}]
Interpolation is a very simple solution, I was unable to use it in an equation I wanted to Solve. Using this one, I could do it. Thank you!
– loxo
Aug 14 '21 at 18:13
If what you are looking for is a piecewise function that connects all the points, this can be done straightforwardly using the Interpolation function. For example:
data = {5, 1, 3, 8};
f := Interpolation[data, InterpolationOrder -> 1];
Plot[f[x], {x, 1, 4}]

You can find the value of your function at any point, for example
{f[1.75], f[2], f[2.75]}
{2., 1, 2.5}
The following is just illustrative. It can be done much shorter and without using Solve[]:
f[l_List] := Module[{ls = Sort@l, p1, lefts, rightRules, m, b},
  p1 = Partition[#, 2, 1] & /@ Transpose@ls;
  rightRules = (First@Solve[{m #[[1, 1]] + b == #[[2, 1]], m #[[1, 2]] + b == #[[2, 2]]},
                           {m, b}] & /@ Transpose@p1);
  lefts = Less @@ Riffle[#, x] & /@ p1[[1]];
  Piecewise[{m x + b /. #[[2]], #[[1]]} & /@ Transpose[{lefts, rightRules}]]
  ]

 l = {{1, 10}, {2, 20}, {3, 15}, {4, 10}};
 Plot[f[l] /. x -> u, {u, 0, 5}]

In any case you should use FormalX instead of x for safety
I will make the same assumptions as other answers (of interpolation of order 1, and unit steps):
fun[u_, x_, edg___] :=
 Piecewise[
  Join[edg,
   MapThread[{#1 (x - First@#2) + First@#3,
      Function[{a, b}, a <= x < b] @@ #2} &, {Differences@u,
     Partition[Range[Length@u], 2, 1], Partition[u, 2, 1]}]]]
Examples:
list = {5, 1, 3, 8};
then
fun[list,x] yields
Plot[fun[list, x], {x, 0, 5}]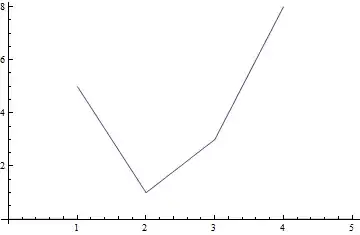
Plot[fun[list, u, {{u^2 + 4, u < 1}, {2 u, u >= 4}}], {u, 0, 5}]

Piecewise. – bill s Feb 25 '14 at 03:25