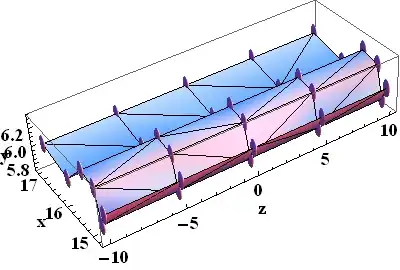
I want the first pic,but i got the second. What can I do?


Below if the code to produce the second pic:
data = {{14.808253637272422`,
    5.992415735398138`, -10}, {14.937895181494618`,
    5.835230243884557`, -10}, {15.104476099263962`,
    6.190504320078969`, -10}, {15.549905577158725`,
    6.242337037739479`, -10}, {16.214292480395272`,
    5.946484831244263`, -10}, {17.172819193670374`,
    6.044620763590807`, -10}, {14.808281657120743`,
    5.992346489742819`, -5}, {14.937944420202394`,
    5.83506166050832`, -5}, {15.104458590180693`,
    6.1905995697624006`, -5}, {15.549909194291196`,
    6.242289007293565`, -5}, {16.21428558314019`,
    5.946304785847829`, -5}, {17.172828128632702`,
    6.044675503473975`, -5}, {14.808370059168467`, 5.992128021118139`,
     0}, {14.93796801813446`, 5.834980865961923`,
    0}, {15.104521660293425`, 6.190256467374961`,
    0}, {15.549917959537805`, 6.242172617112528`,
    0}, {16.214298214579777`, 5.946634515939104`,
    0}, {17.172827172286173`, 6.044669644434473`,
    0}, {14.808196500526428`, 5.992556937854838`,
    5}, {14.937952476296239`, 5.835034078072448`,
    5}, {15.104459789437353`, 6.190593045787643`,
    5}, {15.549890996009355`, 6.242530654951938`,
    5}, {16.21428524490538`, 5.946295956593386`,
    5}, {17.17285709312181`, 6.044852953886377`,
    5}, {14.808354331354467`, 5.992166889379481`,
    10}, {14.937875586457652`, 5.835297333327767`,
    10}, {15.1044365297471`, 6.190719578861889`,
    10}, {15.549897447086584`, 6.242444993694446`,
    10}, {16.214291019501033`, 5.946446696177589`,
    10}, {17.172815114360944`, 6.044595771776242`, 10}};

pica = Graphics3D[Sphere[data, 0.1]]

picb = ListPlot3D[data, InterpolationOrder -> 1,
  MeshFunctions -> {#2 &, #3 &}, Mesh -> All, PlotRange -> All]

Show[pica, picb]