10

I am trying to plot a very simple function f[x_]:=Exp[-x]/x on a log-log scale like this

LogLogPlot[f[x], {x, 10^(-5), 10^7}]

Mathematica graphics

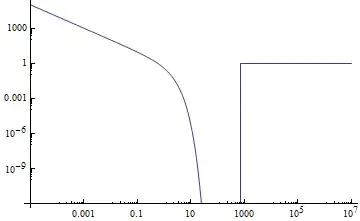
The problem is that for large values of x the plot suddenly jumps to 1 instead of going to zero as it should. I have tried to tabulate the values and increase working precision but it doesn't go away. The problem does not appear if I use

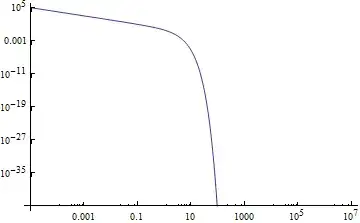
LogLogPlot[Exp[-x]/x, {x, 10^(-5), 10^7}]

Mathematica graphics

Anyone can explain me what is happening?

rhermans
  • 36,518
  • 4
  • 57
  • 149
mia
  • 361
  • 2
  • 9
  • Hey I edited to format your code. In the future, you can format code on your own by selecting the code block and pressing ctrl+k – gpap Feb 26 '14 at 16:42
  • There are some weird things going on here. What version of Mathematica are you using? 8, 9 or 10 for the Raspberry Pi? They give different results. Normally I'd say, just use WorkingPrecision -> 20 if you're getting runaway errors from machine precision. But in this case using that option in v9 gives incorrect results. – Szabolcs Feb 26 '14 at 16:55
  • Yep, I was halfway editing my comment to suggest changing the WorkingPrecision. Then I tried it and, in v9 on OSX at least, it goes to 1 regardless how high WorkingPrecision is. – gpap Feb 26 '14 at 16:59
  • Thank you all for your comments. I am using mathematica 9 on mac, have tried all kinds of working precision but still doesn't work. I would first like to understand what the problem is... – mia Feb 26 '14 at 17:04
  • 2
    one more thing, if I were to plot directly the function Exp[-x]/x, so without difining f first, then it works perfectly. But the function has more parameters etc so I can't leave it like that. What to do? – mia Feb 26 '14 at 17:14
  • 2
    I would file a bug report to WR... – gpap Feb 26 '14 at 17:17
  • @gpap that would be terrible, my project is now compromised... – mia Feb 26 '14 at 17:20
  • @mia Try evaluating your function: LogLogPlot[Evaluate@f[x], {x, 10^(-5), 10^7}] – Michael E2 Feb 26 '14 at 22:17
  • Another log plot related bug: http://mathematica.stackexchange.com/q/15628/ Perhaps the fix there might help here. – Michael E2 Feb 26 '14 at 22:25
  • The error seems to happen when f[x] exceeds $MinMachineNumber. See also http://mathematica.stackexchange.com/q/42093 Setting SetSystemOptions["CatchMachineUnderflow" -> False] fixes the plot (but creates other problems). There's a safer way, but I don't have time right now to answer. – Michael E2 Feb 27 '14 at 18:15

3 Answers3

5

This appears to be some sort of bug in LogLogPlot. Note that you can always compute the function at specific values of x as in most other procedural languages and use one of the List*Plot functions:

With[{x = 10^Range[-5, 7, 0.01]},
    ListLogLogPlot[Transpose@{x, f[x]}, Joined -> True, 
        PlotRange -> {{1*^-5, 1*^7}, {1*^-9, 1*^6}}]]

The only drawback here is that you won't have the benefit of the adaptive sampling in Plot-like functions, but a lot of the time you can live without it.

rm -rf
  • 88,781
  • 21
  • 293
  • 472
5

Or since:

$$e^x=1+\frac{2}{-\coth \left(\frac{x}{2}\right)-1}$$

f[x_] := (1 + (2/(-1 - Coth[x/2])))/x
LogLogPlot[f[x], {x, 10^(-5), 10^7}]

enter image description here

Also, by using Mathematica you can find that

ExpToTrig[Exp[-x]]
(* => Cosh[x] - Sinh[x] *)

Thus using

f[x_] := (Cosh[x] - Sinh[x])/x

produces the same Plot.

Öskå
  • 8,587
  • 4
  • 30
  • 49
  • Well.., the bug appears with plotting Exp[-x] as well. If the actual f[x] has Exp[-x] it is still possible to use the equivalence. (I guess?) – Öskå Feb 26 '14 at 17:40
  • One can define mexp[x_]:=(1 + (2/(-1 + Coth[-x/2]))) and use it instead of Exp[-x] everywhere (since Exp[-x] seems to be the issue). – Öskå Feb 26 '14 at 17:43
  • Thank you, you are very creative, I would have never thought about writing the exponential like that :) – mia Feb 26 '14 at 17:47
  • @mia, I edited so Mathematica thinks for you :) – Öskå Feb 26 '14 at 17:54
  • I would have thought that cosh-sinh would lead to same strange behavior but apparently it works with that as well :). thanks again! – mia Feb 26 '14 at 18:29
0

Just to show LogLogPlot is getting the correct values:

 f[x_] := Exp[-x]/x
 ListLogLogPlot[
     Sort[Reap[
          LogLogPlot[fx=f[x], {x, 10^(-5), 10^7}, 
              EvaluationMonitor :> Sow[{x, fx}]]][[2, 1]]], 
              Joined -> True, PlotRange -> All]

enter image description here

Of course setting a sensible plot range in ListLogLogPlot gives the expected result.

 ListLogLogPlot[
   Sort[Reap[
     LogLogPlot[fx = f[x], {x, 10^(-5), 10^7}, 
          EvaluationMonitor :> Sow[{x, fx}]]][[2, 1]]], Joined -> True, 
          PlotMarkers -> Graphics[Point[{0, 0}]], PlotRange -> {10^-8, 10^7}]

enter image description here

george2079
  • 38,913
  • 1
  • 43
  • 110