I want to plot x[t], when i manipulate w from 0.1 to 1.5. Here is what I've attempted, which does not work as expected.
c = 0.05; f = 0.7;
diffeq = {x''[t] + c x'[t] + Sin[x[t]] + F Cos[w t] == 0};
inicond = {x'[0] == 0, x[0] == 1};
eqnlist = Join[diffeq, inicond];
soln := NDSolve[eqnlist, x, {t, 0, 10}]
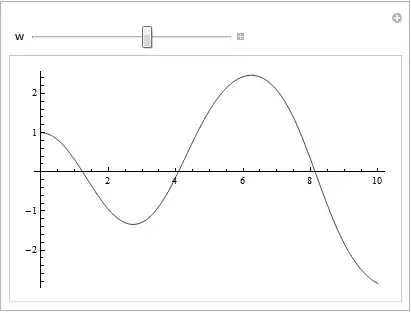
Manipulate[
Plot[Evaluate[{x[t] /.soln}, {t, 0, 10}], PlotRange ->All, AxesLabel-> {t, x}],
{w, 0.1, 1.5, 0.1}]
What is the appropriate way to plot the numerical solution of a differential equation while varying a parameter?