2

I'm trying to do a Fourier Transform of the following Data, but I'm completely stuck.

Here's what I've done so far:

data = Drop[data, 1];
dat = data /. {x_, y_, z_, w_} -> {x + y/12., 10 z};
ListLinePlot[Abs[Fourier[dat]], PlotRange -> {Automatic, {0, 40}}]

I don't understand why it keeps displaying this weird plot enter image description here

Anyone have any clue what I'm doing wrong? I'm just learning this Fourier thing so I'm real lost.
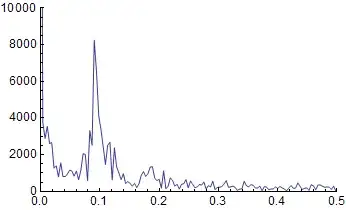
Szabolcs
  • 234,956
  • 30
  • 623
  • 1,263
user1985351
  • 163
  • 5

1 Answers1

5

Fourier does not accept a list of {time, sample} pairs - if you give it a 2D list it will do a 2D transform. Therefore you need to use Fourier on just the list of samples. To get the correct frequency scale on the plot you can use DataRange.

data = Import["http://solarscience.msfc.nasa.gov/greenwch/spot_num.txt", "Table"];

dat = Rest[data] /. {x_, y_, z_, _} :> {x + y/12., 10 z};

n = Length[dat];
t = dat[[2, 1]] - dat[[1, 1]];
fourierdata = Abs @ Fourier[dat[[All, 2]]];

ListLinePlot[fourierdata[[;; 1 + n/2]],
 DataRange -> {0, 1/(2 t)},
 PlotRange -> {{0, 0.5}, {0, 10000}}]

enter image description here

Simon Woods
  • 84,945
  • 8
  • 175
  • 324