Is there a simple way, besides changing my function to use Degree as input, to display the x-axis in degrees in a plot of a function defined with its independent variable taking radians?
Asked
Active
Viewed 3,356 times
4
m_goldberg
- 107,779
- 16
- 103
- 257
henry leung
- 51
- 1
- 2
1 Answers
4
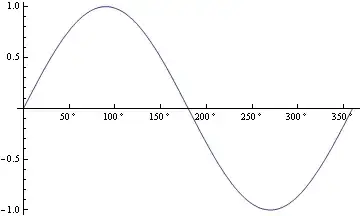
f[range_List, divs_] := {# Pi/180, # Degree} & /@ FindDivisions[range 180/Pi, divs, 10];
plot[g_, range_]:= Plot[g[x], Evaluate@Join[{x}, range], Ticks-> {f[range, 10], Automatic}];
g = Sin;
plot[g, {0, 2 Pi}]
Dr. belisarius
- 115,881
- 13
- 203
- 453
-
-
1@Murta The function doesn't work very well. The standard
Plot[]automatic ticks are much more robust. – Dr. belisarius Mar 14 '14 at 00:27 -
Is there a way to keep the nice sub-ticks when replacing the tick labels? – Alexey Bobrick May 02 '16 at 14:08
Plot[f[x Degree],{x,-1,1}], and you can control exactly what is shown on the axis with theTicksoption ofPlot. Theoretically you could do post-processing on theGraphicobject but that seems to me to be overkill. – William Briand Mar 13 '14 at 20:00Degreebut duplicate imo. Also related – Kuba Mar 13 '14 at 20:46