3

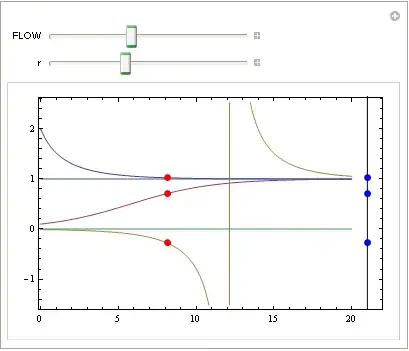
The following code displays three solutions to the logistic ODE with an animated points that follow the solutions.. My goal is to project the solutions on to a vertical phase line. I need to be able to create a phase line of exactly length as the x-axis and have the projected solutions move appropriately. As you can see my projections do not lie on a fixed length copy of the x-axis. Additionally, I want to plot fixed points at x=0 and x=1 and be able to set any color I want to the fixed and moving points. The phase line needs to be closer to the tx-plot as well.

Finally, I'd like to be able vary the parameter r and the initial value x0 in the solution formula (see Initialization code)

Please help relieve my frustration.

Manipulate[

 y1[t_] = y[t, 0.2, 2];
 y2[t_] = y[t, 0.2, 0.1];
 y3[t_] = y[t, 0.2, -0.01];

 If[s == 20, s = 0];

 GraphicsRow[{
   Plot[{y1[t], y2[t], y3[t], 0, 1}, {t, 0, 20}, 
    ImageSize -> {600, 400}, PlotRange -> {{0, 20}, {-1, 2}}, 
    PlotStyle -> {{Thick, Black}, {Thick, Black}, {Thick, 
       Black}, {Thick, Black, Dashed}, {Thick, Black, Dashed}}, 
    BaseStyle -> {FontSize -> 16}, Frame -> True, Axes -> False, 
    FrameLabel -> {t, x}, RotateLabel -> False, AspectRatio -> 0.75, 
    PlotRangePadding -> 0.1, 
    Epilog -> {PointSize[0.02], Red, 
      Point[{{s, y1[s]}, {s, y2[s]}, {s, y3[s]} }]}],

   Graphics[{PointSize[0.02], Red, 
     Point[{{0, y1[s]}, {0, y2[s]}, {0, y3[s]} }]}]}
  ],

 {{s, 0, "FLOW"}, 0, 20, .01, ControlType -> Trigger, 
  AnimationRate -> 3, 
  AppearanceElements -> {"StepLeftButton", "StepRightButton", 
    "PlayPauseButton", "ResetButton", "FasterSlowerButtons"}},

 FrameLabel -> 
  Style["One dimensional flow associated with logistic equation", 16, 
   FontFamily -> "Helv"],

 Initialization -> (y[t_, r_, x0_] := 1/(1 + (1/x0 - 1) Exp[-r t]))
 ]

Mathematica graphics

Dr. belisarius
  • 115,881
  • 13
  • 203
  • 453
Stephen
  • 1,156
  • 5
  • 12

1 Answers1

4
Manipulate[
 y1[t_, r_] := y[t, r, 2];
 y2[t_, r_] := y[t, r, 0.1];
 y3[t_, r_] := y[t, r, -0.01];
 If[s == 20, s = 0];
 Plot[{y1[t, r], y2[t, r], y3[t, r], 0, 1}, {t, 0, 20},
  Frame -> True, Axes -> False,
  PlotRangePadding -> {{.1, 2}, {.1, .1}},
  Epilog -> {
    PointSize[0.02], Red, 
    Point[{{s, y1[s, r]}, {s, y2[s, r]}, {s, y3[s, r]}}],
    Black, Line[{{21, -2}, {21, 3}}], Blue,
    Point[{{21, y1[s, r]}, {21, y2[s, r]}, {21, y3[s, r]}}]}],
 {{s, 0, "FLOW"}, 0, 20, .01},
 {{r, 0, "r"}, 0, 1, .01},
 Initialization -> (y[t_, r_, x0_] := 1/(1 + (1/x0 - 1) Exp[-r t]))]

Mathematica graphics

Dr. belisarius
  • 115,881
  • 13
  • 203
  • 453
  • @bellsarius :-) – Stephen Mar 18 '14 at 18:30
  • @bellsarius: I want to place a fixed circle at {21,0} and a point at {21,1} of color Green. I cannot do this within Epilog. – Stephen Mar 18 '14 at 19:02
  • @bellsarius I want to plot fixed points at {21,0} and {21,1} and be able to set different colors to all of the points - both fixed & moving. – Stephen Mar 18 '14 at 19:10
  • @Stephen Use the Epilog to plot the points and a ColorSetter control to choose the colors – Dr. belisarius Mar 18 '14 at 19:23
  • The file you proposed does not export to a cdf properly. Also, I don't want a ColorSetter control; rather, I just want to fix the colors of the fixed points other than Blue. – Stephen Mar 18 '14 at 23:48
  • 2
    @Stephen A few things: 1) I haven't proposed any "file" 2) You never mentioned exporting to a CDF in the question 3) Change the "Blue" in my code for whatever you want 4) This isn't a "do it for me" kind of site. – Dr. belisarius Mar 18 '14 at 23:59