22

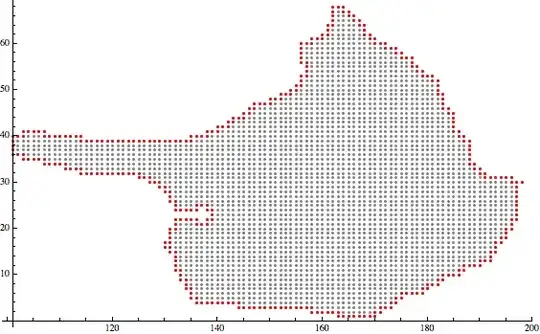
I have an accumulation of points representing a body as you can see in the image below. From this data I want to generate a list of points or a curve, which is the envelope.

ListPlot of the data

The first idea was a convex hull, but the shape of the body is not convex.

ConvexHull of the datapoints

Is there a way to extract the points at the border?

click here for the data

m_goldberg
  • 107,779
  • 16
  • 103
  • 257
zeckra
  • 441
  • 3
  • 8

3 Answers3

28

Given that your data is on an integer grid, it may be sufficient to define a boundary point as one which does not have 4 neighbours (up, down, left, right)

boundary = Complement[spiel, Intersection @@
    Outer[Plus, {{0, 1}, {0, -1}, {1, 0}, {-1, 0}}, spiel, 1]];

ListPlot[boundary]

enter image description here

Simon Woods
  • 84,945
  • 8
  • 175
  • 324
  • A +1 from me because opposed to my solution, your approach doesn't destroy the index information. It seems that Erosion doesn't work with SparseArray and the moment you call Normal, you destroy the information that y runs from -100 to -33.. – halirutan Mar 25 '14 at 13:40
  • +1. Can one extend this to a 3D situation? – RunnyKine Mar 25 '14 at 14:58
  • 1
    @RunnyKine, sure, just put an appropriate list of neighbour coordinates into Outer. – Simon Woods Mar 25 '14 at 17:01
  • Thanks, I did just that after looking at your code. Works fine. – RunnyKine Mar 25 '14 at 17:20
  • If there were "holes" in the original list of points, this would also detect the edges of the holes. Any idea how to get rid of them, i.e. only keep the outermost edge? – chris97ong Dec 08 '19 at 09:07
20

One very simple basic approach is the following (I assume you already loaded the variable spiel)

With[{m = Normal@SparseArray[spiel -> 1]}, 
 boundary = Position[m - Erosion[m, 1, Padding -> 0], 1];
 ListPlot[{Position[m, 1], boundary}, PlotStyle -> {Gray, Red}]]

Mathematica graphics

halirutan
  • 112,764
  • 7
  • 263
  • 474
  • Hi halirutan. What exactly does the variable spiel store? Also, is there a way to: 1) generalise your method if the the list is real valued and 2) if the list is 3D and real valued? – Daniele Binosi Aug 10 '16 at 07:39
  • Extending it to real values would not work in all circumstances because at some point you need to sample the positions onto a fixed grid for the method I showed. With some adaption this might still work, but I would need to see the data give a better answer. 2) In 3D the approach is completely the same as Erosion doesn't care wether it's two- or three-dimensional.
  • – halirutan Aug 10 '16 at 12:53
  • @DanieleBinosi The variable spiel was holding the original list of points. It was provided by the original poster of the question and could be found in the Dropbox link that unfortunately doesn't work anymore. – halirutan Aug 10 '16 at 12:54
  • Considering that spiel is no longer available, how I can apply this on my list of points? – Mehdi Ebadi Jun 29 '20 at 02:42
  • @MehdiEbadi m in my code is just a binary matrix that has 1 for "inside the region" and 0 for "outside the region". Try my example with, e.g. m = Table[If[i^2 + j^2 < 1000, 1, 0], {j, -100, 100}, {i, -100, 100}] and than adapt your code accordingly. – halirutan Jun 29 '20 at 08:19