13

I defined a security bound for a random walk (cube with 15 length) and I have this code to obtain a sample of the random times at which the random walk crosses the boundary for the first time:

w = Do[i = 0; NestWhile[(i++; # + RandomReal[{-1, 1}, 3]) &, {0, 0, 0}, Norm[#] < 15 &];
       Sow[i], {1000}] // Reap 

(code taken from Sample of the random times at which the random walk crosses the boundary)

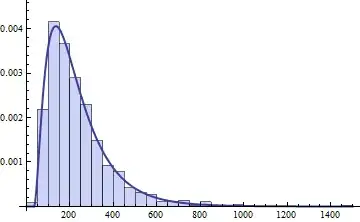
And I constructed a histogram with w:

histogram

And now I want to know the distribution of this data. I thought that it was a gamma because of the histogram, but I ran some tests in Excel and I concluded that it isn't, but I would like to confirm that with Mathematica. Is that possible?

And when I do this:

\[ScriptCapitalH] = DistributionFitTest[w[[2, 1]], Automatic, "HypothesisTestData"];

\[ScriptCapitalH]["FittedDistribution"]

I have for output: NormalDistribution[233.588, 150.231], but skewness[w] = 1.83 (if it was normally distributed, it should be approximately zero).

Would like some help please :)

  • @Szabolcs doesn't this question boil down to "How do I use DistributionFitTest to determine whether or not my data fit a gamma distribution?"? If so, then mma.se may be more appropriate than math. – bobthechemist Mar 25 '14 at 13:56
  • @bobthechemist You're right, I was focusing on "And now i want to know the distribution of this data". – Szabolcs Mar 25 '14 at 14:05
  • 1
    The documentation on this is not at all clear, but I don't think Automatic as the second argument does at all what you think. It seems to just assume a normal dist and the Automatic argument specifies the test type. (Can anyone cook up an example where Automatic returns anything other than NormalDistribution ) ? – george2079 Mar 25 '14 at 15:55
  • 3
    Just for clarity, DistributionFitTest defaults to a test for normality. The fitted distribution is NOT the best fitting distribution. It is the best fitting distribution in the family you are testing. When setting the distribution family to Automatic you are using the normal family of distributions. – Andy Ross Mar 25 '14 at 18:32
  • thanks for help, didnt find that anywhere @Andy Ross, now i have my answer :) – Mariana da Costa Mar 25 '14 at 19:28
  • The new function FindDistribution[] returns a number of useful candidates: FindDistribution[w[[-1, 1]], 4, All, PerformanceGoal -> "Quality"] – J. M.'s missing motivation Jun 28 '16 at 12:44
  • Are the estimated parameters for a gamma distribution (or whatever you end up with) going to be used to compare against some other data or simulations from a different set of initial conditions? If not, why not just use SmoothHistogram or SmoothKernelDistribution? (And even if the distribution is approximately a gamma for all practical purposes, with a large enough sample size you'll be guaranteed to reject that distribution with any of the standard tests.) – JimB Jun 28 '16 at 15:51

2 Answers2

21

The mathematica help is very thorough and is very indicative of what you should do next. By way of the histogram diagram obtained, you can compare your data against the proposed distribution.

Show[Histogram[w[[2, 1]], Automatic, "ProbabilityDensity"], 
Plot[PDF[h["FittedDistribution"], x], {x, 0, 1500}, 
PlotStyle -> Thick]]

NormalFit

The reference points you to run the ProbabilityPlot function so you can see how well the curve fits.

ProbabilityPlot[w[[2, 1]], h["FittedDistribution"]]

ProbabilityPlot

Not that great.

By further exploring the parametric distributions available in Mathematica, all very well documented in the help , the Gamma distribution looks like a good candidate.

dist = GammaDistribution[α, β, γ, μ]
myFit = DistributionFitTest[w[[2, 1]], dist, "HypothesisTestData"]
Show[Histogram[w[[2, 1]], Automatic, "ProbabilityDensity"], 
Plot[PDF[myFit["FittedDistribution"], x], {x, 0, 1500}, 
PlotStyle -> Thick]]

This looks much more like it. GammaFit

ProbabilityPlot[w[[2, 1]], myFit["FittedDistribution"]]

enter image description here

shrx
  • 7,807
  • 2
  • 22
  • 55
Zviovich
  • 9,308
  • 1
  • 30
  • 52
  • thanks for help :D not exactly what i wanted but it was really helpfull. I dont understand is why the output for [ScriptCapitalH]["FittedDistribution"] is not Gammadistribution. And other question when i do KolmogorovSmirnovTest[w[[2, 1]]] mathematica gives me zero, do u have any ideia why this is happening? – Mariana da Costa Mar 25 '14 at 13:48
  • 1
    DEar @MarianadaCosta, I'm not privy to how the algorithms have been developed. It might be that Automatic just defaults to the most used distribution, namely, the Normal Distribution. I would recommend that you take a look a look at EDA (exploratory data analysis). A starting point http://en.wikipedia.org/wiki/Exploratory_data_analysis – Zviovich Mar 25 '14 at 14:55
16

If you wanted to automate things you might do something like this:

 tests = Sort[(g = 
      DistributionFitTest[
           w, #, {"PValue", "FittedDistribution"}])  & /@  {
               GammaDistribution[a, b, c, d], 
               NormalDistribution[a, b],
               ChiSquareDistribution[a],
               HalfNormalDistribution[a],
               LogNormalDistribution[a, b]}]

 {{0., NormalDistribution[232.755, 156.711]},
 {7.09814*10^-19, ChiSquareDistribution[195.469]}, 
 {1.34007*10^-16, HalfNormalDistribution[0.00446664]}, 
 {0.066279,  GammaDistribution[6.16556, 6.45882, 0.548972, 33.4612]}, 
 {0.0966786, LogNormalDistribution[5.27028, 0.590685]}}

 GraphicsGrid[ 
    Partition[ Show[ {Histogram[w, Automatic, "ProbabilityDensity"],
                      Plot[PDF[#[[2]], x], {x, 0, 1500}, PlotStyle -> Thick, 
                 PlotPoints -> 1000 , PlotRange -> {0, 0.008}]}, 
                 PlotRange -> {0, 0.005}, 
                 PlotLabel -> Style[Head[#[[2]]], FontSize -> 10] ] & /@ tests  , 
           3 , 3 , {1, 1} , {}] ]

enter image description here

george2079
  • 38,913
  • 1
  • 43
  • 110