Update: Since version 9, weighted layouts are available. See this answer.
The short answer is, unfortunately no, in version 8.0.* at least, the built-in layout algorithms do not take edge weight into account. Consider a version of your example:
Unweighted
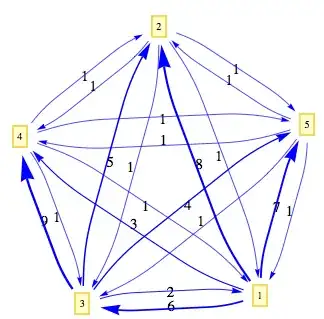
adjMat1 = {{Infinity, 1, 1, 1, 1}, {1, Infinity, 1, 1, 1}, {1, 1,
    Infinity, 1, 1}, {1, 1, 1, Infinity, 1}, {1, 1, 1, 1, Infinity}};
Weighted
adjMat2 = {{Infinity, 8, 6, 3, 7}, {1, Infinity, 1, 1, 1}, {2, 5,
    Infinity, 9, 4}, {1, 1, 1, Infinity, 1}, {1, 1, 1, 1, Infinity}};
Weighted adjacency matrix converted to multiedge rule form
multiedge = DeleteCases[ Flatten@Table[
    If[i == j, Null, Table[i -> j, {adjMat2[[i, j]]}]], {i,
     Length[adjMat2]}, {j, Length@First@adjMat2}], Null]

(* Output:   {1 -> 2, 1 -> 2, 1 -> 2, 1 -> 2, 1 -> 2, 1 -> 2, 1 -> 2, 1 -> 2,
 1 -> 3, 1 -> 3, 1 -> 3, 1 -> 3, 1 -> 3, 1 -> 3, 1 -> 4, 1 -> 4,
 1 -> 4, 1 -> 5, 1 -> 5, 1 -> 5, 1 -> 5, 1 -> 5, 1 -> 5, 1 -> 5,
 2 -> 1, 2 -> 3, 2 -> 4, 2 -> 5, 3 -> 1, 3 -> 1, 3 -> 2, 3 -> 2,
 3 -> 2, 3 -> 2, 3 -> 2, 3 -> 4, 3 -> 4, 3 -> 4, 3 -> 4, 3 -> 4,
 3 -> 4, 3 -> 4, 3 -> 4, 3 -> 4, 3 -> 5, 3 -> 5, 3 -> 5, 3 -> 5,
 4 -> 1, 4 -> 2, 4 -> 3, 4 -> 5, 5 -> 1, 5 -> 2, 5 -> 3, 5 -> 4} *)
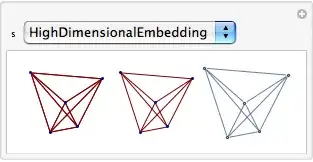
This shows that any of the three plotting methods give essentially the same layout for the same layout (Method/GraphLayout) option.
Manipulate[
 Row[{GraphPlot[multiedge, MultiedgeStyle -> None, Method -> s],
   GraphPlot[adjMat1, MultiedgeStyle -> None, Method -> s],
   AdjacencyGraph[adjMat1 /. \[Infinity] -> 0,
    GraphLayout -> s]}], {s, {"SpringElectricalEmbedding",
   "SpringEmbedding", "HighDimensionalEmbedding", "CircularEmbedding",
    "RandomEmbedding", "LinearEmbedding"}}]
If you were to come up with your own algorithm for allowing for the weights, you could draw graphs using that algorithm using the VertexCoordinateRules option.
There is a Weighted option in the GraphUtilities package, but it doesn't apply to visualisation.