Why does
pPost[1, k_, p_: 2/3, p1_: 1/3, p2_: 2/3] :=
(p p1^k (1 - p1)^(3 - k))/(p p1^k (1 - p1)^(3 - k) + (1 - p) p2^k (1 - p2)^(3 - k));
pPost[2, k_, p_: 2/3, p1_: 1/3, p2_: 2/3] :=
((1 - p) p2^k (1 - p2)^(3 - k))/(p p1^k (1 - p1)^(3 - k) + (1 - p) p2^k (1 - p2)^(3 - k));
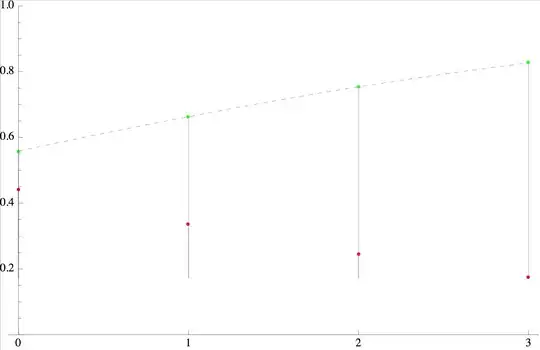
Manipulate[
Show[
Plot[pPost[1, k, p, p1, p2], {k, 0, 3},
PlotStyle -> {Dashed, Thin},
PlotRange -> {All, {0, 1}},
Ticks -> {{0, 1, 2, 3}, Automatic}],
ListPlot[
{{#, pPost[1, #, p, p1, p2]} & /@ Range[0, 3],
{#, pPost[2, #, p, p1, p2]} & /@ Range[0, 3]},
PlotStyle -> {Green, Red},
Filling -> Axis]],
{{p, 2/3}, 0, 1},
Delimiter,
{{p1, 1/3}, 0, 1},
{{p2, 2/3}, 0, 1}]
produce plots where the filling "disconnects" from the axis for some values of the Manipulate parameters?
Try p=0.75, p1=0.7, p2=0.6:
or (weirder) p=p1=p2=0.5
Show. Set the final plot range in theListPlottoo, not just inShow, and set it to the same in all. Sorry if this doesn't help. – Szabolcs Apr 05 '14 at 20:22PlotRange -> {All, {0, 1}}inListPlotseems to do the trick. Where is the need for that documented? – orome Apr 05 '14 at 20:40Showis documented in its help page, both in the 'Details' section as well as the 'Possible Issues'section. – Sjoerd C. de Vries Apr 23 '14 at 13:11