I asked a question about changing Graph properties in a similar way to how Show can change Graphics properties. The answer was to use SetProperty.
Unfortunately this does not work for GraphLayout. Take the following example:
g1 = RandomGraph[{10, 20}]
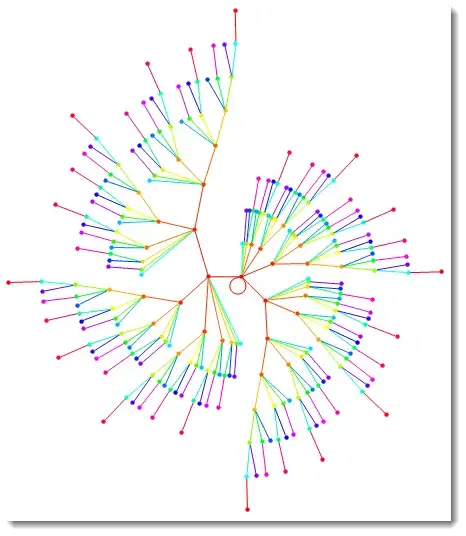
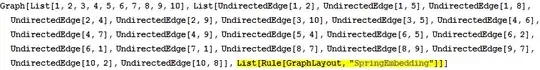
g2 = RandomGraph[{10, 20}, GraphLayout -> "SpringEmbedding"]
{PropertyValue[g1, GraphLayout], PropertyValue[g2, GraphLayout]}
(* ==> {Automatic, "SpringEmbedding"} *)
ng1 = SetProperty[g1, GraphLayout -> "CircularEmbedding"]
ng2 = SetProperty[g2, GraphLayout -> "CircularEmbedding"]
{PropertyValue[ng1, GraphLayout], PropertyValue[ng2, GraphLayout]}
(* ==> {Automatic, "SpringEmbedding"} *)
Note that while GraphLayout can be queried through the standard property API, it doesn't seem like it can be set. Again, a hack like HighlightGraph[g, {}, GraphLayout -> "CircularEmbedding"] will work, but it is just a hack.
One could retrieve the vertex and edge lists of the graph and build a new Graph[...], but that is both tedious and it'll discard other property values.
So, what is the best way to re-layout a graph?
Right-clicking the graph and choosing a new layout works, but I'm looking for a programmatic way. Also, right-clicking and choosing a new layout is terribly slow---much much slower than rebuilding the graph or using HighlighGraph (can anyone reproduce this problem, is it slow for you as well?)
Update
Some spelunking reveals that GraphComputation`CloneGraph[g, GraphLayout -> "CircularEmbedding"] will do the job, but I'd rather not use internal and undocumented functionality for this.


GraphPlotis not appropriate here. I want to re-layout it using the newGraphfunctionality, and also retrieve the coordinates. – Szabolcs Apr 20 '12 at 13:18{PropertyValue[ng1, GraphLayout], PropertyValue[ng2, GraphLayout]}gives{"CircularEmbedding", "CircularEmbedding"}as it should. – kglr Sep 28 '17 at 17:36