This question is strongly related to:
Let’s create sample chart
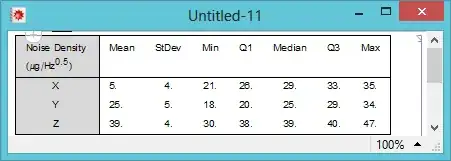
mydata = {{"Noise Density \n(\[Mu]g/\!\(\*SuperscriptBox[\(Hz\), \
\(0.5\)]\))", "Mean", "StDev", "Min", "Q1", "Median", "Q3",
"Max"}, {"X ", 5., 4., 21., 26., 29., 33., 35.}, {"Y ", 25., 5.,
18., 20., 25., 29., 34.}, {"Z ", 39., 4., 30., 38., 39., 40.,
47.}};


myChart =
  Grid[mydata
, BaseStyle -> {FontFamily -> "Helvetica Neue"
, FontTracking -> "SemiCondensed", FontWeight -> “Thin”, FontSize -> 10}
, Frame -> True
, Dividers -> {{True, True}, {True, True}}
, Spacings -> {2, 1}
, Alignment -> {{Center, Left}, Right}
, Background -> {{1 -> LightGray}}]
The chart renders OK on evaluation:

However, when I try to write the chart to a new document:
CreateDocument[ ExpressionCell@myChart]
It inserts it as follows:

What is the correct method of writing a grid to a document?
CreateDocument[ExpressionCell[myChart, ShowStringCharacters -> False]]? – kglr Apr 18 '14 at 15:21SetOptions[EvaluationNotebook[], ShowStringCharacters -> False]works? – kglr Apr 18 '14 at 16:17