Here is how you do this analytically: (using user2790167's pull in pure function form)
nFibers = 50;
mean = 100;
stdev = 20;
fibers = Sort@RandomVariate[NormalDistribution[mean, stdev], nFibers];
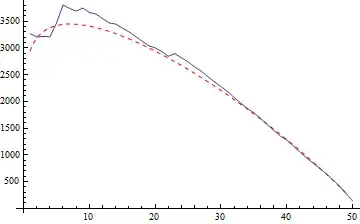
Show[{
Plot[ InverseCDF[ NormalDistribution[ mean, stdev] , nweak/nFibers]
(nFibers - nweak + 1 ), {nweak, 1, nFibers - 1}, PlotStyle -> {Red, Dashed}],
ListPlot[
Rest@First@
Transpose@
NestList[{First@#[[2]] Length@#[[2]], Rest@#[[2]]} &,
{0, fibers}, nFibers], Joined -> True,
AxesLabel -> {"Broken Fibers", "Net Load"}]}, PlotRange -> All,
AxesOrigin -> {0, 0}]
Also it is useful to plot against the strength of the fiber that is about to fail:
(which correlates to strain assuming equal stiffness of the fibers )
 nFibers = 50;
 mean = 100;
 stdev = 20;
 fibers = Sort@RandomVariate[NormalDistribution[mean, stdev], nFibers];
 Show[{
   Plot[  s  (nFibers (1 - CDF[ NormalDistribution[ mean, stdev] , s]) ) ,
       {s, 0, 200}, PlotStyle -> {Red, Dashed}],
   ListPlot[
     First@
        Transpose@
           NestList[{{First@#[[2]] {1, Length@#[[2]]}, Rest@#[[2]]} &,
             {{0, 0}, fibers}, nFibers], Joined -> True,
           AxesLabel -> {"min surviving strength", "Net Load"}]}, PlotRange -> All,
           AxesOrigin -> {0, 0}, AspectRatio -> 1/GoldenRatio]

for large nFibers the simulations converge to the analytic form..

Select. (You can do this analytically as well usingCDFclarify if thats what you mean. ) – george2079 Apr 25 '14 at 14:30listfrom theselectcommand? – user10600 Apr 25 '14 at 14:37RandomVariate.. – george2079 Apr 25 '14 at 14:45