I need to draw a set of curves on one graph (characteristics equations). As you can see they have exchanged x and y axes. My goal is to plot all those curves on one graph. Are there ways to do that?
f[t_, t0_] := -(2 - 4/Pi*ArcTan[2])*Exp[-t]*(t - t0);
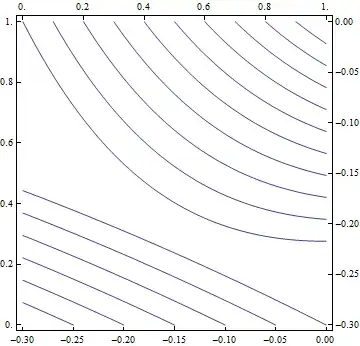
g[x_, x0_] := (x - x0)/(-(2 - 4/Pi*ArcTan[x + 2]));
Show[Table[Plot[f[t, t0], {t, 0, 1},
PlotRange -> {0, -0.3},
AxesLabel -> {t, x}], {t0, 0, 1, 0.1}]]

Show[
  Table[
    Plot[g[x, x0], {x, 0, -0.3}, PlotRange -> {0, 1}, AxesLabel -> {x, t}],
    {x0, 0, -0.3, -0.05}]]