Considering your working example on which I added 99 data of the maximum value:
g = ExampleData[{"NetworkGraph", "HighEnergyTheoryCollaborations"}];
data = (Length /@ ConnectedComponents[g]);
(* adding 99 value so it can be seen *)
data = Flatten@Append[data, ConstantArray[Max@data, 99]];
You can do the following, which is not very good looking in my opinion:
h1 = Histogram[Select[data, # < RankedMax[First /@ Tally@data, 2] &],
  PlotRange -> {{0, RankedMax[First /@ Tally@data, 2]}, {0, Max[Last /@ Tally@data]}},
  Axes -> True,
  AxesStyle -> {Arrowheads[{0, 0.075}], Automatic},
  AspectRatio -> GoldenRatio, ImageSize -> {230, 350}];

h2 = Histogram[Select[data, RankedMax[First /@ Tally@data, 2] < # <= Max@data &], {1},
  PlotRange -> {{Max@data - 2, Max@data + 2}, {0, Max[Last /@ Tally@data]}},
  Axes -> {True, False},
  AspectRatio -> GoldenRatio*6, Ticks -> {{Max@data}},
  ImageSize -> {230/6, 350}];

Grid[{{h1, h2}}, Spacings -> {-1.1, 1}]

I don't like:
- The big arrow. That's all I could come up with that looked correct in my eyes, but it's not good looking.
- The fact that everything is user defined (playing with
AspectRatio, ImageSize or Ticks). There should be way to adjust the width of the last box automatically.
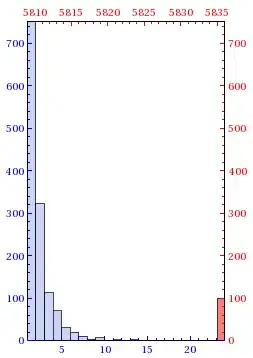
With the same data you can also do the following that I find better looking:
h3 = Histogram[Select[data, # < RankedMax[First /@ Tally@data, 2] &],
  PlotRange -> {{1, RankedMax[First /@ Tally@data, 2]}, {0, Max[Last /@ Tally@data]}},
  AspectRatio -> GoldenRatio, Frame -> {True, True, True, True},
  FrameTicks -> All,
  FrameTicksStyle -> {{Blue, Opacity@0}, {Blue, Opacity@0}},
  ImageSize -> {250, 350}];

h4 = Histogram[Select[data, RankedMax[First /@ Tally@data, 2] < # <= Max@data &], {1},
  PlotRange -> {{Max@data - RankedMax[First /@ Tally@data, 2] - 2, Max@data + 1}, {0, Max[Last /@ Tally@data]}},
  Axes -> None,
  ChartStyle -> Directive[{Opacity@.5, Red}],
  AspectRatio -> GoldenRatio, Frame -> {True, True, True, True},
  FrameTicks -> All,
  FrameTicksStyle -> {{Opacity@0, Red}, {Opacity@0, Red}},
  ImageSize -> {250, 350}];

Overlay[{h3, h4}]

Histogram[Select[Length /@ ConnectedComponents[H], # < 1000 &], PlotRange -> {{0, 50}, All}]
which gives a plot stopping at 50. User said it may be because bin width is autoset. How can I set bin width?
– sdkbj May 06 '14 at 19:04Histogramyou can find help about the function by pressing F1. – Kuba May 06 '14 at 19:13