I want to make a plot similar to LogLinearPlot, but with power of 2 ticks instead of 10 on x axis.
values = {n -> 2^x}
Plot[{Evaluate[f[n] /. values]}, {x, 2, 10}]
How to mark x axis with 2^2, 2^3, ... , 2^10 instead of default 2, 3, ..., 10 ?
I want to make a plot similar to LogLinearPlot, but with power of 2 ticks instead of 10 on x axis.
values = {n -> 2^x}
Plot[{Evaluate[f[n] /. values]}, {x, 2, 10}]
How to mark x axis with 2^2, 2^3, ... , 2^10 instead of default 2, 3, ..., 10 ?
For illustrative purposes:
DiscretePlot[x, {x, 0, 10}, Frame -> True,
 FrameTicks -> {Table[{j,
     Style[Superscript[2, j], ScriptSizeMultipliers -> {0.15},
      ScriptBaselineShifts -> {0, 1}]}, {j, 10}], Automatic, None,
   None}, BaseStyle -> 16,
 PlotLabel -> "\!\(\*SubscriptBox[\(log\), \(2\)]\)(n)"]
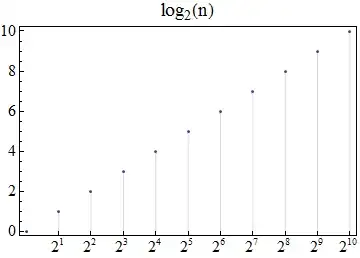
I added the options ScriptSizeMultipliers and ScriptBaselineShifts to illustrate the customizability of appearance (i.e. feel free to play with).
Plot[{2^x}, {x, 2, 10}, Ticks -> {Range[2, 10], 2^Range[2, 10]}]– akater May 08 '14 at 19:50TicksandStandardForm2) Be careful and don't use names starting with Capital letters ... they are used by Mma itself (See also the help forN[])