Consider this simple streamline plot:
StreamPlot[{-y/10, x/10}, {x, -1, 1}, {y, -1, 1},
 StreamColorFunction -> Function[{x, y, u, v}, Hue[v]]]
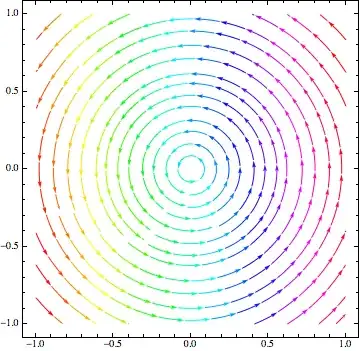
The arguments to the colour function are rescaled to lie between 0 and 1, so the colours span the whole spectrum, as expected.
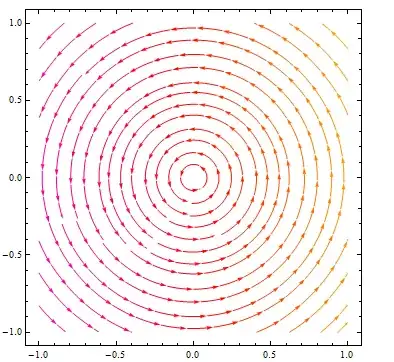
But now I want to turn off colour function scaling and work with the original vector field values. Those lie between -1/10 and 1/10, so I should get only hues between purple and orange:
StreamPlot[{-y/10, x/10}, {x, -1, 1}, {y, -1, 1},
 StreamColorFunction -> Function[{x, y, u, v}, Hue[v]],
 StreamColorFunctionScaling -> False]

I'm sorry, Dave. I'm afraid I can't do that.
Is this a bug? How do I work around it?

Printout the values ofx,y,uandvthat are being passed to the color function,vis notx/10, which is surprising. – rm -rf May 15 '14 at 17:39StreamColorFunctionScaling, but not in the correct way. It's definitely not a behavior that a sane person would expect. But Mathematica is probably thinking it's doing what's best for the mission... – Jens May 15 '14 at 17:42