How to plot a function with different colors. I want to plot the function x^3-x with distinct color. For example, using red from -1.5 to 0 and using green from 0 to 1.5. I know that I have to use PlotStylebut I don't know how write the range of the colors.
Asked
Active
Viewed 166 times
2
Andrea Rosero
- 47
- 1
3 Answers
2
Plot[x^3 - x, {x, -1.5, 1.5},
 ColorFunction -> Function[{x, y}, If[x <= 0, Red, Green]],
 ColorFunctionScaling -> False]

ciao
- 25,774
- 2
- 58
- 139
1
One way will be to break down the plot regions as follows:
xval = {-1/Sqrt[3], 1/Sqrt[3]};
yval = Map[#^3 - # &, xval];

Show[{Plot[t^3 - t, {t, -1.5, -(1/Sqrt[3])},
   PlotStyle -> {Thick, Brown}],
  Plot[t^3 - t, {t, -(1/Sqrt[3]), -(2/(3 Sqrt[3]))},
   PlotStyle -> {Thick, Blue}],
  Plot[t^3 - t, {t, -(2/(3 Sqrt[3])), 1/Sqrt[3]},
   PlotStyle -> {Thick, Orange}],
  Plot[t^3 - t, {t, 1/Sqrt[3], 1.5}, PlotStyle -> {Thick, Yellow}]},
 PlotRange -> {{-1.5, 1.5}, All}, GridLines -> {xval, yval},
 Ticks -> {xval, yval},
 GridLinesStyle -> Directive[Thickness[0.003], Magenta],
 AspectRatio -> 1.5,
 Epilog -> {Red, PointSize[.025],
   Point[{-(1/Sqrt[3]), 2/(3 Sqrt[3])}], Green, PointSize[.025],
   Point[{1/Sqrt[3], -2/(3 Sqrt[3])}], Black,
   Text["top", {-(1/Sqrt[3]), 2.7/(3 Sqrt[3])}],
   Text["bottom", {1/Sqrt[3], -2.7/(3 Sqrt[3])}]}]

RunnyKine
- 33,088
- 3
- 109
- 176
1
colorPlot[fun_, lims_, colList_: {{-Infinity, Infinity}, Blue},
opts : OptionsPattern[Plot]] :=
Module[{colfun = Piecewise[{#[[2]], #[[1, 1]] < \[FormalT] < #[[1, 2]]} & /@ colList]},
Plot[fun@t, {t, lims[[1]], lims[[2]]}, opts,
ColorFunctionScaling -> False,
ColorFunction -> Function[{x, y}, colfun /. \[FormalT] :> x]]
];
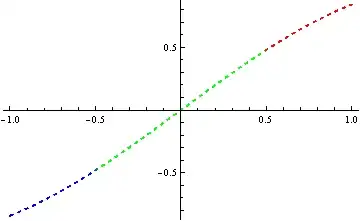
colorPlot[Sin@# &,
{-1, 1},
{{{-1, -1/2}, Blue}, {{-1/2, 1/2}, Green}, {{1/2, 1}, Red}},
PlotStyle -> {Thick, Dashed}]
Dr. belisarius
- 115,881
- 13
- 203
- 453
SwitchorWhichinstead of theIf, then you can delimit as many colors as you'd like. – ciao May 18 '14 at 00:38Switchthere, in any caseWhichis easier for this kind of thing:Plot[t^3 - t, {t, -1.5, 1.5}, ColorFunction -> Function[{t, d}, Which[-1.5 <= t < -1/Sqrt[3], Orange, -1/Sqrt[3] <= t < 0, Purple, 0 <= t < 1/Sqrt[3], Brown, 1/Sqrt[3] <= t < 1.5, Yellow]], ColorFunctionScaling -> False]. – ciao May 18 '14 at 01:07