I would like to create a stereogram from a 3d plot; I would like to export two images of a 3d plot at a slightly different angle, so that when each picture is presented to a different eye, one gets the feeling it is actually 3 dimensional.
I have tried to put two plots next to eachother, then turn one plot slightly by hand (mouse), but when I then export, it is as if I hadn't turned the plot at all!
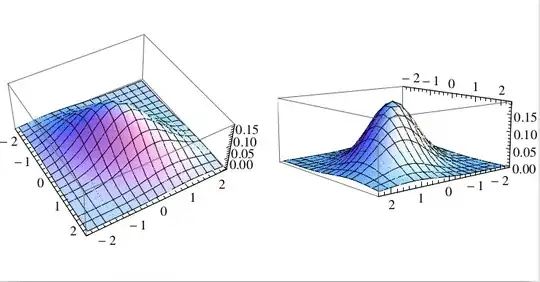
example:
s1 =
  Plot3D[PDF[MultinormalDistribution[{0, 0}, {{1, 1/2}, {1/2, 1}}], {x, y}],
    {x, -2.3, 2.3}, {y, -2.3, 2.3}]
Show[GraphicsArray[{s1, s1}]]
How can I specify at which angle the 3d plot is exported?
PS: Just to be clear: I don't want to rotate the function which is plotted, I want to rotate the plot, including the edges of the bounding box of the plot.

ViewVector? – Öskå May 21 '14 at 12:36Plot3D? – Angelorf May 21 '14 at 12:39Options@Plot3Dat least.. :) – Öskå May 21 '14 at 12:39Options@yet. Thanks. – Angelorf May 21 '14 at 12:42Graphics3D. – Michael E2 May 21 '14 at 14:18