0

I was trying to evaluate the following expression:

RegionPlot[a > 0 && 2 a + b == 0, {a, -2, 2}, {b, -1.5, 1},  
  PlotLegends -> "Expressions"]

The output is:

enter image description here

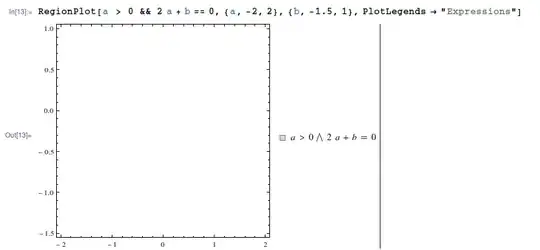
I think this is unexpected. Think about when $a = 0.5$. So, $b = -1$ which is within the range $[-1.5, 1]$. So, this values and other such values should be in a gray region in the plot. But they are not there. Any help?

m_goldberg
  • 107,779
  • 16
  • 103
  • 257
Omar Shehab
  • 173
  • 1
  • 8
  • 3
    From ?RegionPlot, The predicate pred can be any logical combination of inequalities. However, this won't work either: RegionPlot[ a > 0 && 2 a + b <= 0 && 2 a + b >= 0, {a, -5, 5}, {b, -5, 5}] I guess there must be a "true" region (with non null area), because RegionPlot initially evaluates pred at a grid of equally spaced sample points specified by PlotPoints. Then it uses an adaptive algorithm to subdivide at most MaxRecursion times, attempting to find the boundaries of all regions in which pred is True. –  May 25 '14 at 17:31
  • 3
    Jean-Claude is right. To create your plot you should make a ContourPlot of 2 a + b == 0 with RegionFunction -> Function[{a, b}, a > 0]. –  May 25 '14 at 17:40
  • @RahulNarain Are you going to answer or do you think it is a simple mistake? :) – Kuba May 25 '14 at 18:34
  • This works. ContourPlot[2 a + b == 0, {a, -2, 2}, {b, -1.5, 1}, RegionFunction -> Function[{a, b}, a > 0], PlotLegends -> "Expressions"] – Omar Shehab May 25 '14 at 18:54
  • @Kuba: Neither; I thought the question would be closed as a duplicate, but I was too lazy to check :) Turns out I was thinking of a ContourPlot question instead. –  May 25 '14 at 19:41

1 Answers1

4

RegionPlot can only plot filled regions, as explained in Jean-Claude's comment. Your equation defines a curve instead, so you should use ContourPlot and put the other inequality(s) inside its RegionFunction:

ContourPlot[2 a + b == 0, {a, -2, 2}, {b, -1.5, 1}, RegionFunction -> Function[{a, b}, a > 0]]

enter image description here