I've got this plot with two sine waves
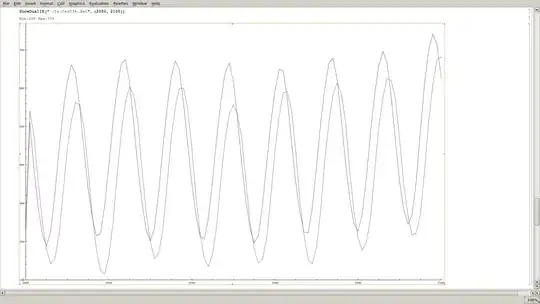
and what I need is follow:
Amplitude values can diverge from time to time like here min 100 and max 700 but another time it's 300 600.
I guess I will not be able to get these nice phased waves from those on my picture.. But let's assume we have only one sampled sine wave. How to translate it to 001111110000011111 where 1s are for sine above "zero"(that's the main problem, every time it will be different point, like here it's around 400) and 0s for below zero. And another difficulty it would be nice to get this conversion on the go/online. Like I don't have whole sampled signal but only let's say 100 last values(10-60 these sine slopes).
Please, can you at least say what I should google? Thank you :)
UPDATE
I've asked a little wrong.. How can I get zero line from signal like this? To apply suggested Sign[]. It's vary bad scenario sine wave..
In my case it's bouncing not around zero but some changing Y. It lasts around one value only few slopes..

ANSWER Well, that's up to how you want to treat the data. I suppose the simplest way is to take the Mean of the data streams, and treat that as the "zero" - so just subtract it from the stream and then do the Sign. Also take a look at Rescale, Clip, and Standardize - all can be used to good effect here, e.g. waveSquared[[All, 2]] = Sign@Standardize@waveSquared[[All, 2]];... – @rasher
Now it looks like this

