If I have a function, f[a, b, c, d], with a, b, c and d varying between 0 and 1 continuously. What would be the best way to explore this function visually with Mathematica? Is evaluating multiple Plot3D expressions with two of the four arguments held constant my only option?
Asked
Active
Viewed 877 times
6
m_goldberg
- 107,779
- 16
- 103
- 257
Sulli
- 2,185
- 14
- 28
3 Answers
12
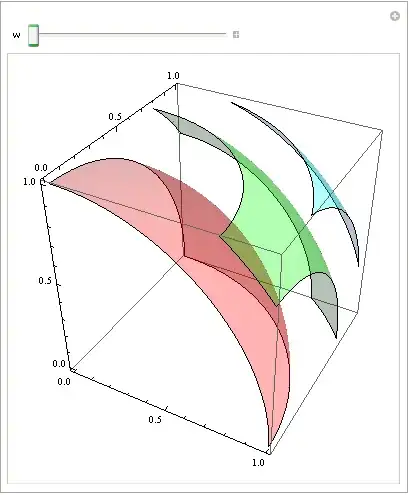
For example:
Manipulate[
 ContourPlot3D[Norm[{x, y, z}]^ (3 + w),
               {x, 0, 1}, {y, 0, 1}, {z, 0, 1},
               ContourStyle -> (Directive[Opacity[.3, #]] & /@ {Red, Green, Cyan}),
               Contours -> {1, 2, 3}, MeshStyle -> None],
{w, 0, 1}]
Dr. belisarius
- 115,881
- 13
- 203
- 453
4
Manipulate is a great tool anyway:
Manipulate[
 ContourPlot3D[
  c - Sin[d] - a x^2 - b y^2 + z^2 == x y z, {x, -2, 2}, {y, -2,
   2}, {z, -2, 2}, Mesh -> None,
  ColorFunction -> Function[{x, y, z}, Hue[z]],
  ContourStyle -> Opacity[0.75]], {a, 0, 1}, {b, 0, 1}, {c, 0, 1}, {d,
   0, 1}]

-
2If I'm not mistaken, what you're visualizing there is a function of seven arguments. – May 28 '14 at 22:58
0
The method you mention, using the Plot3D expressions, may be implemented pair-wise. That is: represent twin spaces (a,b,f) and (c,d,f), display the fixed values (a1,b1,0) and (c1,d1,0), and the functions f(a,b,c1,d1) and f(a1,b1,c,d), in their corresponding space. Next step, treat the "fixed" values as slider ("pilot") values, and plot the corresponding functions accordingly, letting them evolve "in real time" with their "pilot" values. I've done this with another tool, see Youtube demo at https://www.youtube.com/watch?v=s_h8tlTxRos
ContourPlot3D[f==g, ...]but when in the form ofContourPlot3D[f, ...]I don't know what the plot represents – Sulli Jun 02 '14 at 15:161, on the green one the value of the function is2and in the cyan contour the function evaluates to3.Is it clear now? – Dr. belisarius Jun 02 '14 at 15:20