1

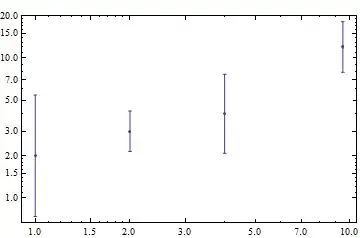
I have data in the form

 d={{x1,y1,dy1},{x2,y2,dy2},..{xn,yn,dyn}}; 

so the error bars are different for each coordinate pair. I want to plot on a logarithmic x-scale. Since I use Mathematica 9 the old library from Mathematica 6 with Errorlogplot does not seem to work. Kind regards Benjamin

neverender
  • 53
  • 1
  • 4

1 Answers1

4

Try the ErrorBarLogPlots package, which you can download here:

Throw it in the folder that opens after evaluating this:

SystemOpen@FileNameJoin[{$UserBaseDirectory, "Applications"}]

Then load the package in Mathematica and go:

<< ErrorBarLogPlots`

ErrorListLogLogPlot[{{1, 2, 2}, {2, 3, 1}, {4, 4, 2.6}, {9.5, 12, 5}},
  Frame -> True, PlotRangePadding -> 0.1]

Mathematica graphics

Other plots available in this package are:

  • ErrorListLogLinearPlot
  • ErrorListLogPlot
Sjoerd C. de Vries
  • 65,815
  • 14
  • 188
  • 323
  • I downloaded it here http://library.wolfram.com/infocenter/MathSource/6747/ and did as you said. When I evaluate the notebook it says installation failed! Does not seem to work with Mathematica 9 + Windows 8 ( probably has nothing to do with windows 8). – neverender Jun 04 '14 at 17:59
  • @neverender What do you mean by evaluate the notebook? Did you do anything other than using Get (<<)? I do have Mathematica 9 be it on Win7. – Sjoerd C. de Vries Jun 04 '14 at 18:07
  • had to give the the installer file administrative rights, my bad. thank you very much! – neverender Jun 04 '14 at 18:16
  • @neverender Just moving the .m file from the .zip file to the directory described above would have been sufficient. I should have described that better. – Sjoerd C. de Vries Jun 04 '14 at 18:26
  • 3
    Note, however, that the error bars produced by ErrorListLogLogPlot are symmetric, which (at least in my opinion) is unexpected on a logarithmic scale. If this aspect is of importance, the error bars could always be constructed manually, e.g. by (ab)using ErrorListPlot: dat={{1,2,1},{2,3,1},{4,4,2.6},{9.5,12,5}} ListLogLogPlot[ dat[[All, 1 ;; 2]], Prolog -> ErrorListPlot[ With[{x = Log[#1], y = Log[#2]}, {{x, y}, ErrorBar[{Log[#2 - #3] - y, Log[#2 + #3] - y}]}] & @@@ dat, PlotRange -> All, Axes -> False][[1]], PlotRange -> {{0.5, 10}, {0.5, 50}} ] – dakta Jun 04 '14 at 20:29
  • @dakta Symmetry in error bars on a log scale are not always wrong. If one takes logs (or the square root or some other monotonic transformation) and finds the resulting data/residuals approximately symmetric, then symmetry of error bars on the transformed scale is the appropriate display. – JimB Aug 19 '16 at 15:09
  • The relative error is sometimes used to force error bar symmetry in transformed data rather than using absolute error. Anyone know if the above package does this? http://faculty.washington.edu/stuve/log_error.pdf – tquarton Mar 14 '17 at 20:51