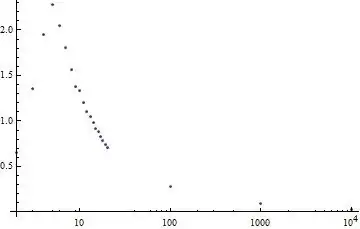
This code, doesn't show me data corresponding to x axis values 1000 and 10000
    ListLogLinearPlot[{
{2.`,0.6566004672633555`},{3.`,1.3583960946639664`},
{4.`,1.9488104079494668`},{5.`,2.2751624091109224`},
{6.`,2.0481641523922276`},{7.`,1.8076861039841228`},
{8.`,1.567222153249036`},{9.`,1.3828655013386686`},
{10.`,1.333307015795397`},{11.`,1.207450315597537`},
{12.`,1.1053326628916935`},{13.`,1.0461569618818984`},
{14.`,0.9827412485818572`},{15.`,0.9148871558873501`},
{16.`,0.8820097240704773`},{17.`,0.8305457378907795`},
{18.`,0.7840815651752284`},{19.`,0.7418232652693492`},
{20.`,0.7037798895571512`},{101.`,0.2777401685500814`},
{1000.`,0.09241053289867017`},{10000.`,0.029907070416454667`}
},PlotRange->All]
I tried specifying PlotRange->All and PlotRange->{{0.,10001.},All}, but it didn't help. Could anyone please clarify what could be the problem?