I am trying to combine two graphics objects using Show.
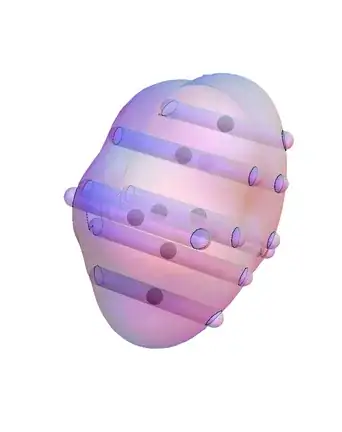
The first one is an isosurface:
data = Import["/PATH/furan-ks.sdat", "Table"];
ALEE = Nearest[data[[All, {1, 2, 3}]] -> Rescale[data[[All, 4]]]];
cfALEE = ColorData["Rainbow"]@First@ALEE[{#1, #2, #3}] &;
isosurface=ListSurfacePlot3D[data[[All, {1, 2, 3}]], BoxRatios -> Automatic,
ColorFunction -> cfALEE, ColorFunctionScaling -> False,
Boxed -> False, Axes -> False, Mesh -> None, MaxPlotPoints -> 25,
ImageSize -> 500]

The second one is a sequence of points:
 geom = Import["/PATH/furan.geom", "Table"];
 AngToAu = 1.88971616463;
 Function[x, x*AngToAu];
 geom = Map[%, geom, {2}];
 Show[Graphics3D[{Black, PointSize[0.05], Point[geom]}, Boxed -> False]]

I want the points to appear on the same plot as the surface and be plotted at the appropriate scale. A command I am using:
Show[isosurface, Graphics3D[{Black, PointSize[0.05], Point[geom]}, Boxed -> False]]
The catch is that the points effectively appear inside the surface and are NOT visible. I need to somehow project them on the surface or make them visible through the surface.
How do I deal with this? Any suggestions?
EDIT: attached the files isosurface geom


Tubes out of it? I'm afraid that you should provide the code for the isosurface and the points so one can reproduce it. – Öskå Jun 11 '14 at 11:00Opacitydirective for the code that generatesisosurface? – m_goldberg Jun 11 '14 at 12:31Tube:) – Öskå Jun 11 '14 at 18:46Tubesolution? One could also simply put the points on the surface.. :) – Öskå Jun 11 '14 at 18:50Tubesolution here? – molkee Jun 11 '14 at 18:55{# - {4, 0, 0}, # + {4, 0, 0}} & /@ geom; Show[Graphics3D[Tube[#, 0.1] & /@ %], isosurface]– Öskå Jun 11 '14 at 19:00PlotStyle -> Opacity@.5toListSurfacePlot3D. – Öskå Jun 11 '14 at 19:23