Two questions, but I am not sure whether they are already answered or not.
How can I create
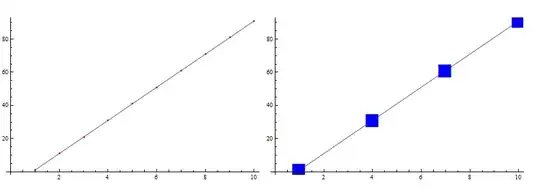
PlotMarkers(inListLinePlot) with less points (less markers)? Or markers with some intervals. I have tried the Mesh option, but it does not work; it messes up all the plots.Is it possible to create
PlotMarkersfor normalPlot, notListPlot? One way is to export the data to the list, but I would like to do it directly.
More information:
Suppose ListLinePlot of a number of data lists with legends.
based on the suggestions, I have changed my plots into this, but honestly I cannot understand how it works!
style = Sequence @@ {Frame -> {{True, False}, {True, False}},
FrameTicks -> {{0, 1, 2, 3}, {0, 0.4, 0.8, 1.5}, None, None},
FrameStyle -> Directive[Black, 16, FontSlant -> Plain],
LabelStyle -> Directive[FontSlant -> Plain],
AxesStyle -> Lighter@Gray, TicksStyle -> Black,
LabelStyle -> {GrayLevel[0], 14, FontSlant -> Plain,
FontFamily -> "Helvetica"}, ImageSize -> 300,
AspectRatio -> 1/GoldenRatio}
ListLinePlot[{c1, c2, c3, c4}, PlotRange -> Full,
Evaluate@style,
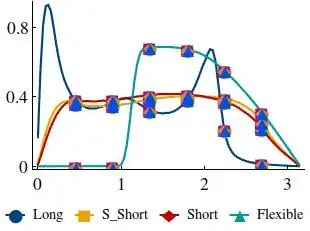
PlotLegends -> Placed[{Long, S_Short, Short, Flexible}, Below],
PlotStyle -> (Directive[
AbsoluteThickness[2], #] & /@ (ColorData[81] /@ Range[6])),
MeshFunctions -> {Abs[#1] &, Abs[#1] &, Abs[#1] &, Abs[#1] &},
Mesh -> 6, PlotMarkers -> {Automatic, 20},
MeshStyle -> {ColorData[81] /@ Range[6], ColorData[81] /@ Range[7],
ColorData[81] /@ Range[8], ColorData[81] /@ Range[9]}]
The output is something like this, where as you can see each Markers has all the colours together. How can I solve this problem and improve it? Another problem is the distribution of the Markers which is not good.


ListLinePlotwith all the data, the second would be aListPlotwith the desired number of data (e.g. each 2) withPlotMarkers. ThenShowwould make it fit :) – Öskå Jun 11 '14 at 21:37PlotLegends. DoesShowremove it? – Öskå Jun 11 '14 at 21:59PlotLegends:) – Öskå Jun 11 '14 at 22:07Meshas a vehicle to change marker numbers. – eldo Jun 11 '14 at 22:35