2

Here is the curve below. (written as a position vector)

r = {Cos[7 Pi*t], Cos[6.2*Pi*t], 2.5*t}
ParametricPlot3D[r, {t, 0, 2}]

I want to know how I can mark specific points on this curve, for example when t = 0 and t=1.

I would also like to label those points.

Öskå
  • 8,587
  • 4
  • 30
  • 49
Lebouski
  • 23
  • 3

3 Answers3

5

You can use Graphics3D and Show:

r[t_] := {Cos[7 Pi*t], Cos[6.2*Pi*t], 2.5*t} ;
Show[ParametricPlot3D[r[t], {t, 0, 2}],
 Graphics3D[{
   PointSize@0.05, Point[r[#] & /@ {0, 1}],
   Text[#, #2] & @@@ 
    Thread[{{"Start", "Middle"}, {0, 0, .2} + # & /@ (r@# & /@ {0, 1})}]}]]

Mathematica graphics

Öskå
  • 8,587
  • 4
  • 30
  • 49
2

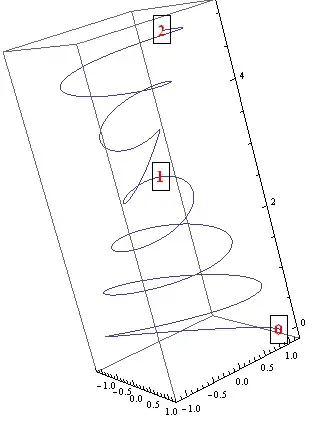
You can also use MeshFunctions but you need to "cheat" to include the t=0 point, e.g.

This is an edited post based on the correct comments by Oska and gpap. In my original answer I used the equivalent of Function[{x,y,z,t},z] though my intention was Function[{x,y,z,t},t]. I have corrected and now labelled the points.

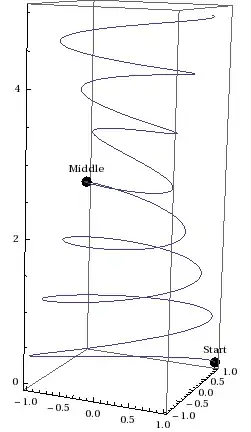
r[t_] := {Cos[7 Pi*t], Cos[6.2*Pi*t], 2.5*t};
Show[ParametricPlot3D[r[t], {t, -0.01, 2}, MeshFunctions -> (#4 &), 
  Mesh -> {{0., 1}}, MeshStyle -> {PointSize[0.03], Red}], 
 Graphics3D[
  MapThread[
   Text[Framed[#1], r[#2], {1, -1}] &, {{"Position 1", 
     "Position 2"}, {0, 1}}]]]

enter image description here

ubpdqn
  • 60,617
  • 3
  • 59
  • 148
  • is there a way i can label those points? – Lebouski Jun 17 '14 at 13:41
  • Shouldn't be the end point (t = 2) placed at the end of the curve? The t=1 point is wrong as well I'm afraid. – Öskå Jun 17 '14 at 14:14
  • @Oska the OP specifically mentions t=0 and t=1 hence my mesh points...I have only displayed and not labeled so will revise when I get chance – ubpdqn Jun 17 '14 at 20:07
  • What I meant is that.., since the function is plotted from 0 to 2, for t=2 the point should be in the end right? (at the top in that case) – Öskå Jun 17 '14 at 20:16
  • @Öskå is right. Your mesh function is now labelling the curve at the point where its z value is 1 and not at the point where the parameter t is 1. In ParametricPlot3D the option MeshFunctions takes four arguments, the x, y, z coordinates and the parameter along the curve. You can either replace MeshFunctions -> (#3/2.5 &) or MeshFunctions -> (#4 &) to get the right result. Then you'll have (at least) an upvote :) – gpap Jun 18 '14 at 09:22
  • @gpap thank you (and Oska) for pointing out my mistake...you are both absolutely correct that I am merely showing the z values and not the parameter...will correct... – ubpdqn Jun 18 '14 at 09:26
  • No problem - this would be my preferred method too (hence the upvote) – gpap Jun 18 '14 at 10:33
1

Another way to use Mesh (credit: this answer by @BobHanlon )

r = {Cos[7 Pi*t], Cos[6.2*Pi*t], 2.5*t};

ParametricPlot3D[r, {t, 0, 2},  Mesh -> {{#, {PointSize[0], 
  Text[Framed@Style[Round@#, Red, Bold, 16], r /. t -> #]}} & /@ {0.00001, 1, 1.99999}}]

enter image description here

kglr
  • 394,356
  • 18
  • 477
  • 896