2

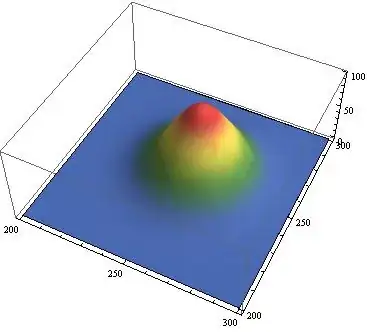
I have a large data set (512 x 512) and I have problems plotting it. ListPointPlot3D works fineenter image description here

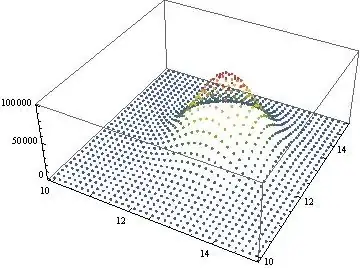
But ListDensityPlot won't go through all the points (the same goes for ListPlot3D): enter image description here

Is there a way to make ListDensityPlot take all points? Or at least a more complete sample of them?

EDIT

Not exactly the same data, but a similar one that can be easily generated:

data=Flatten[Table[{(x - 0.5)*5*^-8, (y - 0.5)*5*^-8, 
    0.1*Exp[-(x*5*^-8 - 1.28*^-5)^2/1*^-12]*
     Exp[-(y*5*^-8 - 1.28*^-5)^2/1*^-12]}, {x, 1, 512}, {y, 1, 512}], 
  1];
Noel
  • 291
  • 1
  • 7

1 Answers1

3
fun = {(x - 0.5)*5*^-8, (y - 0.5)*5*^-8, 0.1*Exp[-(x*5*^-8 - 1.28*^-5)^2/1*^-12]*Exp[-(y*5*^-8 - 1.28*^-5)^2/1*^-12]};

Restrict the plotting area and multiply with 1000:

data = Flatten[Table[fun, {x, 200, 300, 3}, {y, 200, 300, 3}], 1]*1000

ListPointPlot3D[data, PlotRange -> Full, ColorFunction -> "DarkRainbow"]

enter image description here

ListDensityPlot[data, Mesh -> 10]

enter image description here

You can also use Plot3D:

plot = Plot3D[fun, {x, 200, 300}, {y, 200, 300},
  PlotRange -> All,
  Mesh -> False,
  ColorFunction -> "DarkRainbow"]

enter image description here

eldo
  • 67,911
  • 5
  • 60
  • 168