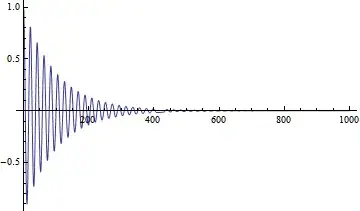
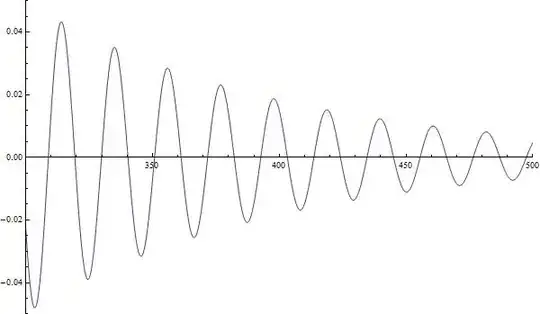
This is an example, I plot a function and find it has a defect when x approximates 400.
Plot[Cos[.3 x] Exp[-0.01 x], {x, 0, 1000}, PlotRange -> All]
Another example, we calculate the orbit of planet motion. As we know, the orbit of planet is ellipse when the total energy is negative. However, if we calculate it in a long time, the result will deviate from ellipse markedly - while Mathematica has no any warning or message here!
The code and result showed below:
M = 4; a = 700; (*a is the total time of this simulation*)
s =
    NDSolve[{x''[t] == -((GM (x[t] + 1))/((x[t] + 1)^2 + y[t]^2)^1.5),
             y''[t] == -((GM y[t])/((x[t] + 1)^2 + y[t]^2)^1.5), y[0] == 2,
             x[0] == .3, x'[0] == .2, y'[0] == -.1}, {x, y}, {t, 0, a},
             MaxSteps -> 10^8];
ParametricPlot[Evaluate[{x[t], y[t]} /. s], {t, 0, a}]

What I wonder is how to make sure Mathematica's result is exactly correct? When we find something special with Mathematica, how can we know it is a new thing, or just a wrong result of Mathematica?
PlotPoints,MaxRecursionandMethodin your plot visualization example). The documentation is pretty good pointing out gotchas and their effects and ways to avoid them. – ciao Jun 24 '14 at 06:02