I'd like to draw some curves using Plot, and I tried follow codes:
 Plot[Table[n/Sqrt[\[Pi]] Exp[-n^2 x^2], {n, {3, 5, 7}}], {x, -1, 1},
 PlotStyle -> Directive[Black, Thick],
 AxesStyle ->
 Directive[Arrowheads[0.04], GrayLevel[0.7], Thick, Opacity[1]],
 Ticks -> None, PlotRange -> {{-1.2, 1.2}, {-0.7, 4.5}},
 AspectRatio -> 1, RegionFunction -> Function[{x}, Abs[x] < 1]]
Then it comes out this:
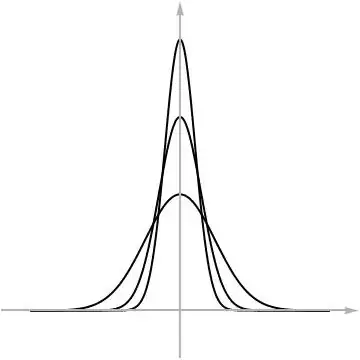
Which I confused is that the gray axes are in the front of the black curves(esp. for the x axes). How can I move the axes backward to show my curve well?
ShoworOverlay. No time atm for a full answer with example. – Johu Jun 29 '14 at 12:06Method -> ("AxesInFront" -> False)– eldo Jun 29 '14 at 12:25Overlayis ok, butShowcan't solve this problem, becauseShowwill apply the same Graphics options to all objects. – HaoLiang Jun 29 '14 at 12:43