With a custom ChartElementFunction you can automate the angles of the labels (using tricks similar to the ones used in this Q/A)
ClearAll[cedFunc];
cEDF = ChartElementDataFunction;
cedFunc[datafunc_: cEDF["Sector"]][{{t0_, t1_}, {r0_, r1_}}, y_, z___] :=
    {datafunc[{{ t0, t1}, {r0, r1}}, y, {}],
     Text[Style @@ z[[1]],
          ((r1 + r0)/2) {Cos[(t0 + t1)/2], Sin[(t0 + t1)/2]},
          Automatic, -(r0 + .0001) {Cos[(t0 + t1)/2], Sin[(t0 + t1)/2]}]};
Usage examples:
dt = {10, 5, 22, 63};
labels = {"Gold (10%)", "Silver (5%)", "Currency (22%)",  "Demand Deposits (63%)"};
styles = {RGBColor[0, 1, 0], RGBColor[0, 0, 1],
          Directive[GrayLevel[0], 24], RGBColor[1, 1, 0]};
newdata = Thread[dt -> Thread[{labels, styles}]];

Row[PieChart[newdata, ImageSize -> 600, BaseStyle -> {FontSize -> 18},
           PlotLabel -> #, #, SectorOrigin -> {Automatic, .1},
           ChartElementFunction -> (cedFunc[])] & /@
   {ChartStyle -> 1,  ColorFunction -> "Rainbow"}]

Row[PieChart[newdata, ImageSize -> 600, BaseStyle -> {FontSize -> 18},
           ColorFunction -> "Rainbow", PlotLabel -> #, #,
           ChartElementFunction -> (cedFunc[])] & /@
   {SectorOrigin -> {{Pi/2, "Counterclockwise"}, .1}, SectorOrigin -> {{Pi}, .1}}]

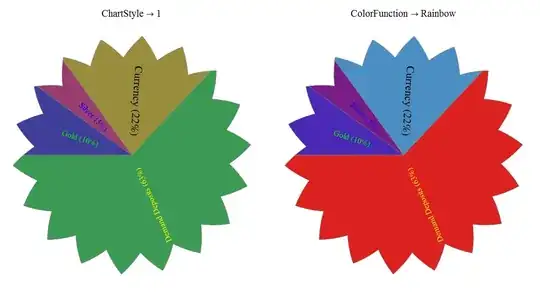
dtf = cEDF["TriangleWaveSector", "AngularFrequency" -> 18, "RadialAmplitude" -> 0.1`];
Row[PieChart[newdata, ImageSize -> 600, BaseStyle -> {FontSize -> 18},
             PlotLabel -> #, #,
             ChartElementFunction -> (cedFunc[dtf])] & /@
   {ChartStyle -> 1, ColorFunction -> "Rainbow"}]
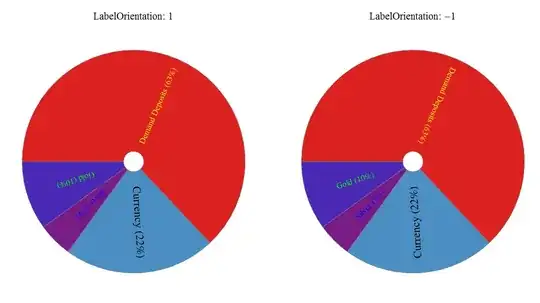
Update: Controlling label orientation
cedFunc2[datafunc_: cEDF["Sector"]][o_: (-1)][{{t0_, t1_}, {r0_, r1_}}, y_, z___] :=
      {datafunc[{{ t0, t1}, {r0, r1}}, y, {}],
       Text[Style @@  z[[1]],
           ((r1 + r0)/2) {Cos[(t0 + t1)/2], Sin[(t0 + t1)/2]},
           Automatic, o ( r0 + .0001) {Cos[(t0 + t1)/2], Sin[(t0 + t1)/2]}]};

Row[PieChart[newdata, ImageSize -> 600, BaseStyle -> {FontSize -> 18},
             ColorFunction -> "Rainbow",
             PlotLabel -> ("LabelOrientation: " <> ToString[#]),
             SectorOrigin -> {{Pi}, .1},
             ChartElementFunction -> (cedFunc2[][#])] & /@
    {1, -1}]