You can use MakeBoxes to format output pretty much however you like. This is what Mathematica does for InterpolatingFunction. You may be able to glean something by inspecting the output cell or from FormatValues[InterpolatingFunction]. Unlike InterpolatingFunction, I included an Interpretation, which means that the output in the notebook may be copied and used. The InterpolatingFunction has a little + button that toggles between information panes. I've included a PaneSelector and an Opener for that feature, in case you wanted that. Just like InterpolatingFunction, this leaves little Dynamic bits littering your notebook.
Toy example:
MakeBoxes[myFN[n_], fmt_] := ToBoxes[
   Interpretation[
    Row[{
      HoldForm[myFN][
       DynamicModule[{open = False},
        Panel[Grid[{{
            Opener[Dynamic[open]],
            Graphics[{Green, Rectangle[]},
             ImageSize -> {Automatic,
               Dynamic[
                3.5*(CurrentValue["FontCapHeight"]/
                   AbsoluteCurrentValue[Magnification])]}],
            PaneSelector[{
              False -> Row[{"Domain: ", Reals}],
              True -> Column[{Row[{"Domain: ", Reals}],
                              Row[{"Formula: ", myFN[n][\[FormalX]]}]
                       }]},
             Dynamic[open],
             ImageSize -> Automatic (* pane resizes to current expression *)
             ]
            }}, Alignment -> {Left, Top}]] (* grid alignment *)
        ]]}],
    myFN[n]],  (* interpretation *)
   fmt];

makeFN[n_?NumericQ] := myFN[n];
myFN[n_?NumericQ][x_] := x^n
Usage:
f = makeFN[3]

f[4]
(* 64 *)
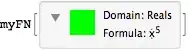
With the Opener open:
makeFN[5]
Copying the output from above and evaluating it at 2:

(* 32 *)


Panelwith some info. I'll see if i can find a link to how to make them in your own functions. darren glosemeyer (formerly) at WRI wrote this up a few years ago. – Mike Honeychurch Jul 09 '14 at 22:49