Bug introduced in 10.0.0 and fixed in 10.0.1
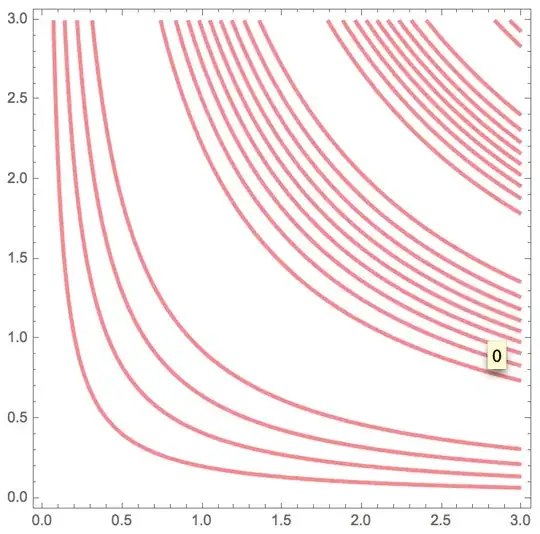
For some weird reason, they apparently changed the styling of contours in ContourPlot for 10.0. Here is a comparison of the results for V9 and V10 (first 9, then 10):
ContourPlot[Sin[x y], {x, 0, 3}, {y, 0, 3},
    ContourShading -> None,  ContourStyle -> {{Red, Thickness[0.008]}}]
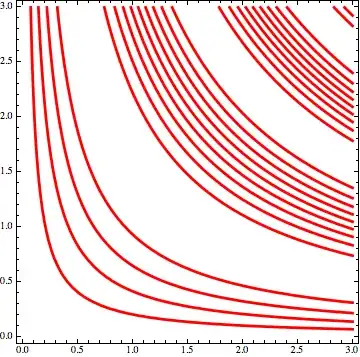 Version 9
 Version 10
Firstly, can I override the coloring? I would like to keep the solid colors that were in V9. And secondly, where do those dark spots come from? Is this a bug?
Edit: yes, this does look like a bug. The dark spots are only visible in the Mac version.
Interestingly enough, for about half a second after the output appears, what I see on the screen is similar to what Export produces (shown below). The only difference is that the lines are thinner in the exported .png (another bug?). After those 0.5 seconds, another level of transparency kicks in and I see what is shown in the top picture below.
ContourPlot[Sin[x y], {x, 0, 3}, {y, 0, 3},
    Contours -> {.9}, ContourShading -> None,
    ContourStyle -> {{Red, Thickness[0.17]}}]
 <- What I see.
 <- What
 Export produces.

PlotThemeto traditional? – Yi Wang Jul 10 '14 at 06:58Classic? It's okay but it adds a strange blue frame even with `Frame->None" added. And the dark spots are still suspicious. – Alex Bogatskiy Jul 10 '14 at 07:05ContourStyle -> {{Red,Opacity[1],Thickness[0.008]}}gives the same contour line colors as in v9. – kglr Jul 10 '14 at 07:25Contours -> {.9}, ContourShading -> None, ContourStyle -> {{Red,Thickness[0.1]}}– sebhofer Jul 10 '14 at 11:30Exportshows (see the edited post). – Alex Bogatskiy Jul 10 '14 at 11:38Opacity[0.5]toOpacity[1]. – Michael E2 Aug 09 '15 at 12:08