8

I'm trying to draw a ListPlot where the x and y axis have the same scale.

My data is

{{100, 500}, {461/5, 473}, {548/5, 452}, {1459/10, 437}, {974/5, 428}, {250, 425}, 
 {1526/5, 428}, {3541/10, 437}, {1952/5, 452}, {2039/5, 473}, {400, 500}}

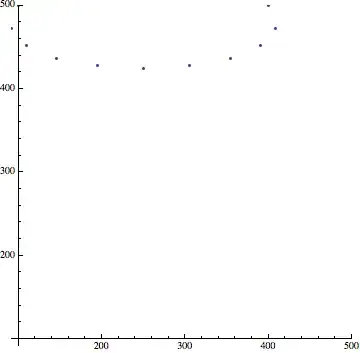
A simple ListPlot will result in:

Listplot no scale

where the x and y axis have a different scales.

I want them to force them to have the same scale. So far I've been able to achieve this only by explicitly setting PlotRange to the same value for x and y, and using AspectRation->1.

Example:

range := {Min[Flatten[x]], Max[Flatten[x]]}
ListPlot[x, PlotRange -> {range, range}, AspectRatio -> 1]

The result is:

List plot scaled

Questions:

  • Is there a Plot option to force the scale to be uniform? Do I always have to set the same range and AspectRatio to 1?

  • From the second image there is satisfying y ∈ [400, 500] and x < 100 with an x value that is lying outside of the drawing range. I thought by using the Min of all x and y this could not happen. What am I doing wrong?

m_goldberg
  • 107,779
  • 16
  • 103
  • 257
Marco83
  • 213
  • 1
  • 2
  • 4
  • 1
    AspectRatio -> Automatic. PlotRange in form {min, max} applies only to y axis. The x is Automatic, that's why the point is missing. – Kuba Jul 10 '14 at 07:49

1 Answers1

2

As far as I know there is no other way besides setting the Options you describe, but there are many ways to make setting those Options more convenient. You can use SetOptions on ListPlot to make them the defaults, or you can use methods such as those shown here:

Regarding the BONUS: you must also set the AxesOrigin:

ListPlot[x,
 PlotRange -> {range, range},
 AspectRatio -> 1,
 AxesOrigin -> range[[1]]
]

enter image description here

Mr.Wizard
  • 271,378
  • 34
  • 587
  • 1,371
  • 2
    ListPlot[x, PlotRange -> All, AspectRatio -> Automatic] – Kuba Jul 10 '14 at 07:57
  • @Kuba I don't think that's what the OP wants, at least as I read the question. – Mr.Wizard Jul 10 '14 at 08:00
  • I see, I think it is, but my interpretations "sometimes" fail. The range used by OP is equal for both axes only to make aspectratio->1 work, that's what I think. – Kuba Jul 10 '14 at 08:01
  • @Kuba In retrospect I can see that interpretation now too, and I think you are probably correct. Alas, wasted effort. But I'll wait for the OP to confirm before I Close. – Mr.Wizard Jul 10 '14 at 08:03
  • Thanks for the answers. I don't specifically need the same range, I was just trying to have the same scale on the x and y axis. It seems that Kuba's first comment to this answer does the trick, although at a first glance it might not seem so, as the ticks on the y have a different resolution than the ticks on the x. – Marco83 Jul 10 '14 at 10:23