0

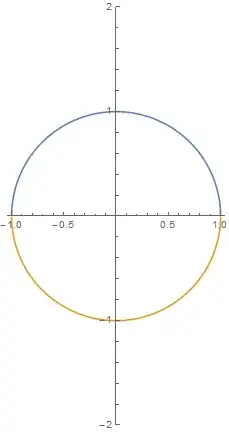
I want to use the the following two functions to plot a perfect looking circle, but the graph always ends up looking a bit squashed. I've been playing with some of the parameters of the function but can't seem to get it to look right still.

Here is the function:

Plot[{Sqrt[1 - x^2], -Sqrt[1 - x^2]}, {x, -2, 2}, PlotRange -> {-2, 2}]

Thanks for the help!

Tim H UK
  • 165
  • 1
  • 6
  • I can't find a question which I think this one duplicates, but this question is addressed in the docs under Plot > Examples > Options > AspectRatio. So suggest closing as "easily found in the documentation". – m_goldberg Jul 23 '14 at 17:51

2 Answers2

2

Change PlotRange to {-1, 1} and set AspectRatio to 1.

Plot[{Sqrt[1 - x^2], -Sqrt[1 - x^2]}, {x, -2, 2}, 
 PlotRange -> {-1, 1}, AspectRatio -> 1]

Result:

enter image description here

PS: That's one of the way, to get the desired output.

m0nhawk
  • 3,867
  • 1
  • 20
  • 35
2

Just add AspectRatio -> Automatic (the default value is 1/GoldenRatio):

Plot[{Sqrt[1 - x^2], -Sqrt[1 - x^2]}, {x, -2, 2}, 
 PlotRange -> {-2, 2}, AspectRatio -> Automatic]

enter image description here

Niki Estner
  • 36,101
  • 3
  • 92
  • 152
  • That is interesting! Why do you think it is set up like that with the default being 1/GoldenRatio? Does it benefit some other type of graphics like that? – Tim H UK Jul 23 '14 at 16:42
  • 2
  • 1
    @TimHUK: I think the idea is that the axes in Plot often show different quantities (e.g. meters versus seconds), where PlotRange->Automatic would make no sense, and often give extremely stretched results. So WRI chose a fixed ratio that's supposed to be pretty. (But that's really just guessing.) – Niki Estner Jul 23 '14 at 17:06