I would like to create a map which will show lakes and rivers together with elevation contours and contour labels. What is the simplest way to do this with GeoGraphics in version 10?
The solution I have (below) looks much too convoluted.
I need to plot this point on the map:
pos = WeatherData["KP60", "Coordinates"]
This is good, except the background is not what I need:
g = GeoGraphics[{PointSize[Large], Darker@Red, Point[pos]}]

Since I can't seem to mix two GeoStyles, I tried overlaying a polygon that contains the contours. This lead to the following:
{range, projection} = {GeoRange, GeoProjection} /. Options[g, {GeoRange, GeoProjection}]

{a, b, d, c} = Tuples[Reverse@range]

GeoGraphics[{{GeoStyling["ContourMap", ContourShading -> None,  ContourLabels -> True], Polygon[{a, b, c, d}]}, {PointSize@Large, Darker@Red, Point[pos]}}, GeoRange -> range]
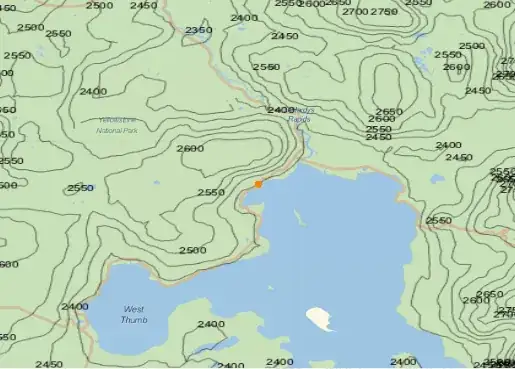
However, now the projection has changed, and adding GeoProjection -> projection causes the polygon not to show. Is there a fix for this?
