I have this graph:
ShowLegend[
Plot[Sin[x], {x, 0, 10}, Filling -> Axis, FillingStyle -> {Red, Blue}],
{{{Graphics[{Blue, Disk[{0, 0}, 1]}, ImageSize -> 5], Sin[x] > 0}, {Graphics[{Red, Disk[{0, 0}, 1]}], Sin[x] < 0}}}]
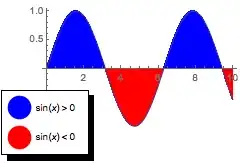
and I would like to change the size of the disks in the legend. Unfortunately, using the ImageSize option doesn't work Graphics[{Red, Disk[{0, 0}, 1]},ImageSize -> 2]
What should I do in this case?

Needs["PlotLegends`"]is obsolete, thePlotoptionPlotLegendsshould be used now. – Öskå Jul 29 '14 at 16:22PlotLegendbutPlotLegendsinstead :) Since v9PlotLegendhas been replaced byPlotLegendsand it works pretty fine I think :) – Öskå Jul 29 '14 at 16:40Disk[{0, 0}, Scaled@.2](or any number you want) instead of a radius of1. See here. – Öskå Jul 29 '14 at 16:42