4

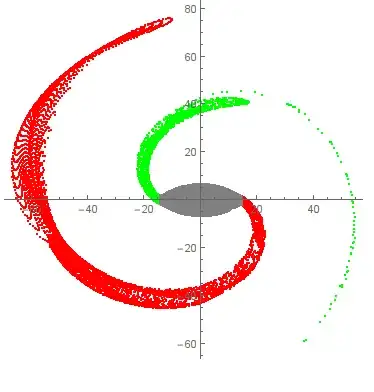
I have a data file containing the position of about $10^5$ stars of a spiral galaxy. Here is the plot

enter image description here

and this is the corresponding code

Clear["Global`*"]
SetDirectory[" ... "];

data = Import["data_SGC.out", "Table"];
L0 = ListPlot[data, PlotStyle -> {Blue, PointSize[0.001]}, Axes -> False, 
              Frame -> True, FrameLabel -> {"x", "y"}, 
              RotateLabel -> False, LabelStyle -> Directive[FontFamily -> "Helvetica", 20], 
              AspectRatio -> 1, PlotRange -> 100, ImageSize -> 550];

As we can see, there are two arms starting at about $(x,y) = (-14.6,0)$ and $(x,y) = (14.6,0)$. Now I would like to customize ListPLot, so as the arm starting at the left part $(x,y) = (-14.6,0)$, be in green color, while the other one in red. All the other points between the two yellow banana-type areas should be in gray.

Any suggestions?

The complete data file can be found here: data. Obviously, I could not generate simple random data in order to replicate this complicated spiral structure.

Vaggelis_Z
  • 8,740
  • 6
  • 34
  • 79
  • So if it's just about the ListPlot, do we need all the ContourPlot and RegionPlot? I guess data = Import[..] and ListPlot[...] would be enough. – Öskå Jul 31 '14 at 09:40
  • @Öskå You are right, ContourPlot and RegionPlot are not needed, so I removed them. See the revised post. – Vaggelis_Z Jul 31 '14 at 09:44
  • At least now one can read the text and see the picture in the same time :) – Öskå Jul 31 '14 at 09:48

1 Answers1

10

You have somehow to segment your data. Here you could use the radius + FindClusters:

    radius = 14.6;
    data1 = FindClusters[Select[data, Norm[#] > radius &], 2,Method -> "Agglomerate"];
    Show[
      ListPlot[data1, PlotRange -> Full, AspectRatio -> 1, PlotStyle -> {Green, Red}],
     ListPlot[Select[data, Norm[#] < radius &], PlotRange -> Full, AspectRatio -> 1, PlotStyle -> Gray]
    ]

This will give you something like this:

enter image description here

Julian S.
  • 1,018
  • 9
  • 8
  • That's exactly what I was looking for! One minor detail. How can I set correctly PointSize[0.001] to all three lists (gree, red, gray)? – Vaggelis_Z Jul 31 '14 at 14:32
  • Disregard my last comment. I found the solution. PlotStyle -> {Directive[Darker[Green], PointSize[0.001]], Directive[Red, PointSize[0.001]]}] – Vaggelis_Z Jul 31 '14 at 14:37
  • @Öskå Yes it was very easy to set the correct PointSize. – Vaggelis_Z Jul 31 '14 at 14:38