I just want to know if there's a way to plot sets in the complex plane. For example $$A=\{z\in \mathbb{C},z+e^{z}=0\},\\A=\{z\in \mathbb{C},\Re(z)+e^{z}\geq0\}.$$
Asked
Active
Viewed 511 times
1 Answers
1
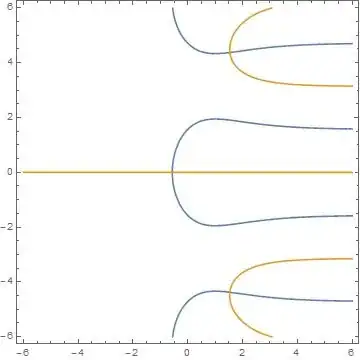
You can do f.e.
fun = u + v I + E^(u + v I);

ContourPlot[{Re[fun] == 0, Im[fun] == 0}, {u, -6, 6}, {v, -6, 6}]
eldo
- 67,911
- 5
- 60
- 168
ContourPlot[{Re[fun] == 0, Im[fun] == 0}, {u, -6, 6}, {v, -6, 6}, PlotLegends -> {Re, Im}]– eldo Jul 31 '14 at 21:53