4

I attempt to trace the path of a point when shift-dragged on a polar coordinate as shown on the picture below. But I only managed to snap the point to the grid. Insight on how to accomplish this? Any help would be much appreciated.

VPOS = {1, 1};
oVPOS = {1, 1};

angle[p_] := (
  ang = ArcTan[Abs@p[[2]]/Abs@p[[1]] // N ];
  Which[p[[1]] >= 0 && p[[2]] >= 0 , Return[ang ],
   p[[1]] < 0 && p[[2]] >= 0 , Return[Pi - ang ],
   p[[1]] < 0 && p[[2]] < 0 , Return[-Pi + ang ],
   p[[1]] >= 0 && p[[2]] < 0 , Return[-ang ]
    ];) 

cnt[p_] := (
  d = Round@EuclideanDistance[{0, 0}, p];
  the2 = Abs@Ceiling[ArcTan[p[[2]]/p[[1]]]/(Pi/12)];
  Return[{Sign[p[[1]]] d Cos[the2*Pi/12 ], Sign[p[[2]]] d Sin[the2 *Pi/12 ]}];)

cnt2[p_] := (
  od = Round@EuclideanDistance[{0, 0}, oVPOS];
  othe2 = Ceiling[angle[oVPOS]/(Pi/12) ] ;

  d = EuclideanDistance[{0, 0}, p];
  the2 = angle[p];

  dd = Round@d;
  dthe2 =   Ceiling[the2/(Pi/12)];

  Dthe = Abs[od*(  the2 - othe2) ] ;
  Dd = Abs[ d - od];
  If[Dthe > Dd,
   Return[{  dd Cos[ the2],  dd Sin[ the2 ]}],
   Return[{  d Cos[dthe2*Pi/12],  d Sin[dthe2*Pi/12]} ]
    ]
  )

grids[min_, max_] := 
  Join[Range[Ceiling[min], Floor[max]], 
   Table[{j + 1, Lighter@Lighter@Lighter@Lighter@Green}, {j, 
     Round[min], Round[max - 1], 1}]];

DynamicModule[{pnt = {1, 1} },
  EventHandler[
    Dynamic@Graphics[
      {PointSize[Large], Red, Point[cnt2[VPOS]]},
      Axes -> True,
      GridLines -> grids,
      PlotRange -> {{-10, 10}, {-10, 10}},
      Prolog -> {
        Lighter @ Lighter @ Blue,
        Table[Circle[{0, 0}, r], {r, 1, 14}],
        Table[Line[{{-15 Cos[the], -15 Sin[the]}, 
                    {15 Cos[the], 15 Sin[the]}}], 
        {the, 0, Pi, Pi/12}]}],
  {"MouseDragged" :> (
    oVPOS=VPOS;
    VPOS = MousePosition["Graphics"])}]]

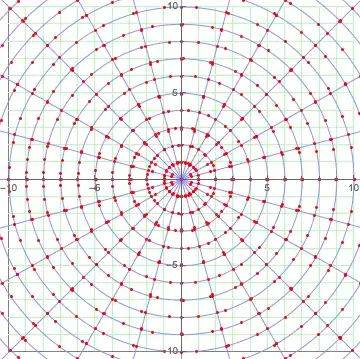
This is what my code produces:

plot achieved

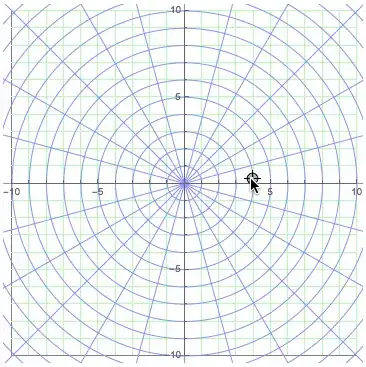
This is what I want to see:

plot wanted

Putterboy
  • 4,661
  • 1
  • 19
  • 30

2 Answers2

6

Here's one solution that meets the criterions. I'll walk through the main ideas step by step.

First I started by creating a list of circles and a list of lines. Then I formed a region from those elements, which I called grid. I also added the gridlines that were used originally and so recreated the plot:

circles = Table[Circle[{0, 0}, r], {r, 1, 14}];
lines = Table[Line[{{-15 Cos[the], -15 Sin[the]}, {15 Cos[the], 15 Sin[the]}}], {the, 0, Pi, Pi/12}];
grid = RegionUnion[circles, lines];

gridLines[min_, max_] := Join[Range[Ceiling[min], Floor[max]], Table[{j + 1, Lighter@Lighter@Lighter@Green}, {j, Round[min], Round[max - 1], 1}]]

bg = Graphics[{
   Lighter@Lighter@Blue, circles, lines
   },
  Axes -> True,
  PlotRange -> {{-10, 10}, {-10, 10}},
  GridLines -> gridLines
  ]

Background

Next I created a list of all the points where circles meet lines. Then I discretized the grid using DiscretizeRegion and retrieved the points generated by that algorithm.

nodes = Join[
   Flatten[Table[N@{r Cos[the], r Sin[the]}, {the, 0, Pi, Pi/12}, {r, -15, 15}], 1],
   MeshCoordinates@DiscretizeRegion[grid]
   ];

Show[bg, Graphics[{Red, Point@nodes}]]

Discretizedregion - plot points

If I had generated the points manually I could have distributed them more evenly and so on. It would have yielded a better result. The idea is that when you move the locator over any of these points they will be added to a list of "visited" points. Then all I'll draw a red line through all of these visited points.

The locator is constrained to the grid in such a way that it doesn't allow for diagonals crossings or any other discontinuous moves. The basic principle is the same that I wrote about here. The final code looks like this:

DynamicModule[
 {
  pt = {4, 0},
  regNearest = {0, 0},
  nodes = Join[
    Flatten[
     Table[N@{r Cos[the], r Sin[the]}, {the, 0, Pi, Pi/12}, {r, -15, 15}], 1],
    MeshCoordinates@DiscretizeRegion[grid]
    ],
  visited = {}
  },
 LocatorPane[
  Dynamic[pt, (
     regNearest = RegionNearest[grid, #];
     If[
      Norm[regNearest - pt] < 0.5,
      pt = RegionNearest[grid, #]
      ];
     visited = Join[
       visited,
       Select[nodes, Norm[pt - #] < 0.25 &]
       ]
     ) &],
  Dynamic@Show[
    bg,
    Graphics[{Red, Thickness[Large], Line[visited]}]
    ]
  ]
 ]

Example

C. E.
  • 70,533
  • 6
  • 140
  • 264
3

Here is some code to get you started. I say "started" because this isn't a fool-proof solution. For one thing, it doesn't provide a way to retract a segment should the user make an bad drag. There are also some refresh issues to be dealt with. A full solution will a fair amount of additional work, and I don't have time to work it out right now.

cnt[p_] := Module[{
    d = Round @ EuclideanDistance[{0, 0}, p],
    the2 = Abs @ Ceiling[ArcTan[p[[2]]/p[[1]]]/(Pi/12)]},
  {Sign[p[[1]]] d Cos[the2 Pi/12], Sign[p[[2]]] d Sin[the2*Pi/12]}]

grids[min_, max_] := 
 Join[Range[Ceiling[min], Floor[max]], 
  Table[{j + 1, Lighter @ Lighter @ Lighter @ Green}, {j, Round[min], Round[max - 1], 1}]]

With[{start = {4. Cos[15. °], 4. Sin[15. °]}}, 
  DynamicModule[{pnt = start, VPOS = start, path = {start}}, 
    EventHandler[
      Dynamic @ Graphics[
        {Red, PointSize[Large],
         Thick, Point[cnt @ VPOS], Line[AppendTo[path, cnt @ VPOS]]},
        Axes -> True,
        GridLines -> grids,
        PlotRange -> {{-10, 10}, {-10, 10}},
        Prolog -> {
          Lighter @ Lighter @ Blue,
          Table[Circle[{0, 0}, r], {r, 1, 14}],
          Table[Line[{{-15 Cos[the], -15 Sin[the]}, 
                      {15 Cos[the], 15 Sin[the]}}], 
            {the, 0, Pi, Pi/12}]}], 
      {"MouseDragged" :> (VPOS = MousePosition["Graphics"])}]]]

polar-path

m_goldberg
  • 107,779
  • 16
  • 103
  • 257
  • I'm sorry, I didn't make myself clear enough. The path I need are only the collections of the ray-segments and arcs the point passed through, not including the diagonals. – Putterboy Aug 05 '14 at 08:09
  • @user16069. Although your comment invalidates my answer, it does not make what you actually want clear. I suggest you edit your question and give a precise specification of what you mean by "... only the collections of the ray-segments and arcs the point passed through, not including the diagonals". – m_goldberg Aug 05 '14 at 16:51