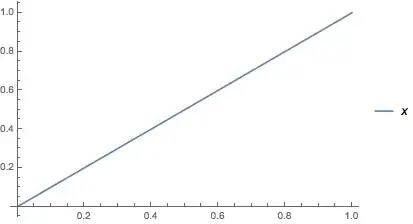
This is an intentional change to make PlotLegends -> "Expressions" more consistent with PlotLegends -> Automatic. Both now do not produce legends when only one line is present. What you are looking for is PlotLegends -> "AllExpressions" which has the old behavior, e.g.
Plot[x, {x, 0, 1}, PlotLegends -> "AllExpressions"]
More generally, PlotLegends operates based on whether or not two plots are distinguishable. In other words, if there is no displayed difference between two plots, two legends won't be displayed. For example,
Plot[{x, x^2}, {x, 0, 1}, PlotStyle -> Blue, PlotLegends -> "Expressions"]

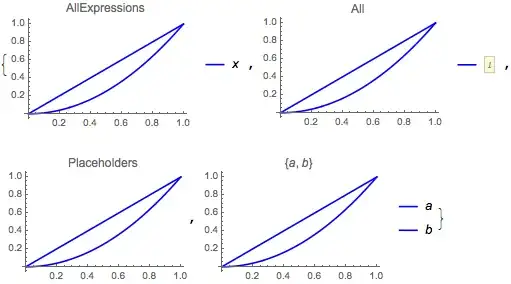
Contrast this with
Table[
 Plot[{x, x^2}, {x, 0, 1}, PlotStyle -> Blue, PlotLegends -> legend, PlotLabel -> legend],
 {legend, {"AllExpressions", All, "Placeholders", {a, b}}}
]
After the number of distinguishable plots are determined, that gives you the number of legends to expect, once the no single legend rule is accounted for. So, these all should give two legends,
Plot[{x, x^2, x^3}, {x, 0, 1}, PlotStyle -> {Blue, Green}, PlotLegends -> "Expressions"]

Table[
 Plot[{x, x^2, x^3}, {x, 0, 1}, PlotStyle -> {Blue, Green},
   PlotLegends -> legend, PlotLabel -> legend],
 {legend, {"AllExpressions", All, "Placeholders", {a, b}}}
]

 ===================================

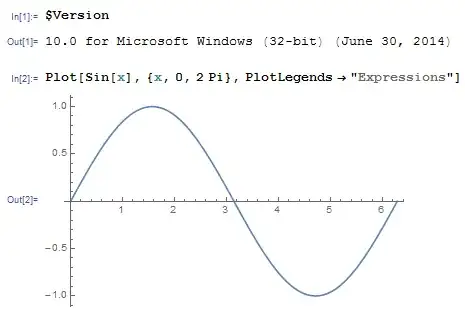
PlotLegendsfails whenPlotis given a single simple argument such asSin[x], and this worked in V9. I tested on OS X. Looks like a bug to me. – m_goldberg Aug 07 '14 at 10:30