3

I'm looking for something similar to AbsoluteOptions but that can be evaluated inside the function. That is, I want to read the absolute settings of options specified in the current context. For example, instead of:

AbsoluteOptions[
 Plot[
  Sin[x]
  , {x, 0, 2 Pi}
  , PlotRange -> Automatic
  ]
 , PlotRange]

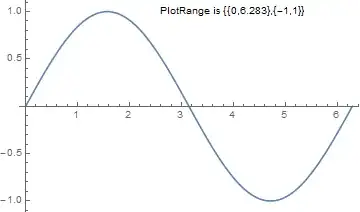
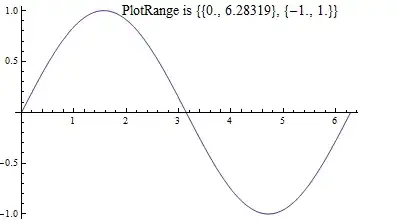
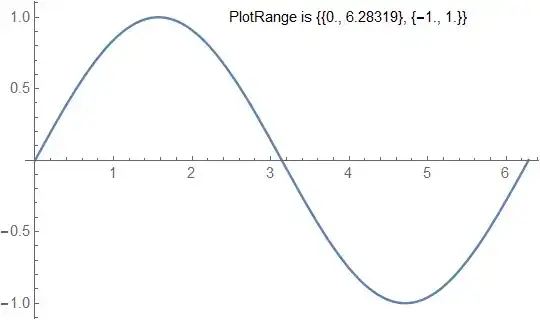
{PlotRange -> {{0., 6.28319}, {-1., 1.}}}

I would like to have something like

Plot[
 Sin[x]
 , {x, 0, 2 Pi}
 , PlotRange -> Automatic
 , Epilog -> Inset[
   "PlotRange is " <> ToString@AbsoluteOptions[PlotRange]
   , {4, 1}]
 ]

Mathematica graphics

is it possible to read the absolute settings for options associated with the current function environment?

rhermans
  • 36,518
  • 4
  • 57
  • 149

2 Answers2

7

Not sure how robust it is, but the following seems to work for PlotRange:

ClearAll[plt];
plt = Plot[Sin[x], {x, 0, 3 Pi}, PlotRange -> Automatic, 
           PlotLabel -> Dynamic@("PlotRange is " <> ToString@PlotRange[plt])]

and

ClearAll[plt1];
plt1 = Plot[Sin[x], {x, 0, 3 Pi}, PlotRange -> Automatic, 
          PlotLabel ->  Dynamic@("PlotRange is " <> 
                           ToString@(PlotRange /. AbsoluteOptions[plt1, PlotRange]))]

both give

enter image description here

Similarly,

ClearAll[plt2];
plt2 = Plot[Sin[x], {x, 0, 2 Pi}, PlotRange -> Automatic,
      Epilog -> Dynamic@Inset[
               Style["PlotRange is " <> ToString@PlotRange[plt2], 14], {4, 1}]]

and

 ClearAll[plt3];
 plt3 = Plot[Sin[x], {x, 0, 2 Pi}, PlotRange -> Automatic,
    Epilog -> Dynamic@Inset[
     Style["PlotRange is " <> ToString@(PlotRange /. AbsoluteOptions[plt3, PlotRange]),
             14], {4, 1}]]

both give

enter image description here

kglr
  • 394,356
  • 18
  • 477
  • 896
6

You can use DisplayFunction for this:

Plot[Sin[x], {x, 0, 2 Pi}, 
 DisplayFunction :> (Show[#, 
     Epilog -> 
      Inset["PlotRange is " <> ToString@PlotRange[#], {4, 1}]] &)]

Instead of buggy PlotRange and AbsoluteOptions you can use much more reliable plotRange function from this answer:

plotRange[plot : (_Graphics | _Graphics3D | _Graph)] := 
 Reap[NotebookDelete[
    First@{PrintTemporary[
       Show[plot, Axes -> True, Frame -> False, 
        Ticks -> ((Sow[{##}]; Automatic) &), 
        DisplayFunction -> Identity, PlotRangePadding -> None, 
        ImageSize -> 0]], FinishDynamic[]}]][[2, 1]]

Plot[Sin[x], {x, 0, 2 Pi}, 
 DisplayFunction :> (Show[#, 
     Epilog -> 
      Inset["PlotRange is " <> ToString@plotRange[#], {4, 1}]] &)]

plot

Speaking about ContourPlot, there is no way to extract the plot range for Z-direction because produced 2D Graphics object does not contain this information. But you can catch the call to Contours using the technique used in the plotRange function:

{pl, plRange} = 
  Reap[ContourPlot[x^2 - y^2, {x, -2, 2}, {y, -2, 2}, 
    Contours -> ((Sow[{##}]; {-1, 0, 1}) &)]];
plRange

{{{-4., 4., 10}}}

I do not know what the third number means but the first two correspond to the actual plot range in Z-direction as can be seen from Plot3D:

plotRange[Plot3D[x^2 - y^2, {x, -2, 2}, {y, -2, 2}]]

{{-2., 2.}, {-2., 2.}, {-4., 4.}}

Alexey Popkov
  • 61,809
  • 7
  • 149
  • 368