I have been making ternary plots of data that is a list of sets of 3 numbers, where the numbers in each set sum to one (call this "DATA"). To do this, I first transform DATA onto the 2D surface with the following:
transf[{a_, b_, c_}] := {b + c/2, (Sqrt[3] c)/2}

Map[transf,DATA].
This gives a list of sets of 2 numbers that map onto a simplex (call this DATA2). This is how I've plotted DATA2:
Show[{
  RegionPlot[Sqrt[3] a1 - a2 < 0, {a1, 0, .5}, {a2, 0, 1},
   DisplayFunction -> Identity, PlotStyle -> White,
   BoundaryStyle -> None],
  RegionPlot[Sqrt[3] a1 + a2 > Sqrt[3], {a1, .5, 1}, {a2, 0, 1},
   DisplayFunction -> Identity, PlotStyle -> White,
   BoundaryStyle -> None],
  RegionPlot[a2 < 0, {a1, 0, 1}, {a2, -.2, 1},
   DisplayFunction -> Identity, PlotStyle -> White,
   BoundaryStyle -> None],
  ListPlot[{{0, 0}, {1, 0}, {.5, Sqrt[3]/2}, {0, 0}}, Joined -> True,
   PlotStyle -> {Black, Thickness[.015]}],
  ListPlot[{DATA2}, Joined -> True,
   PlotMarkers -> Automatic]},
 AspectRatio -> Automatic, Frame -> False,
 PlotRange -> {{0, 1}, {0, 1}}]
Example:

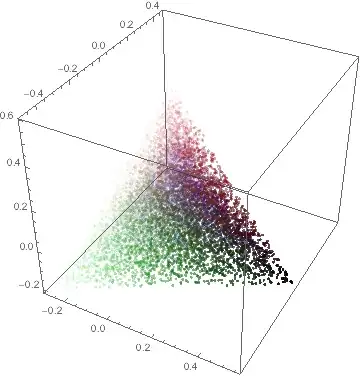
Question: Now, I have an extended data set that is made up of sets of 4 numbers that sum to one. I'd like to plot the data in an analogous way, but now on the corresponding tetrahedron. However, I'm not sure how to transform the data or how to draw the appropriate tetrahedron.
Can anyone help with this, please?

DATAwas not given nor an image initially (and I usually do not pore over code until I can see what the issue is). See the update -- adding another data set with a different color should be easy. – Michael E2 Aug 15 '14 at 13:02Boxed -> Falseand leave out theAxesoption. And you're welcome. :) – Michael E2 Aug 15 '14 at 13:08Line[<>]withArrow /@ Partition[Range@Length@pts, 2, 1]-- is that what you're after? Sometimes coloring is used to show the progression of time. – Michael E2 Aug 15 '14 at 16:02