Consider the image below:
GraphData[{"Wheel", 7}]

Is it possible in Mathematica to lay several of these Graph along each other and then get the coordinates of the resultant network?
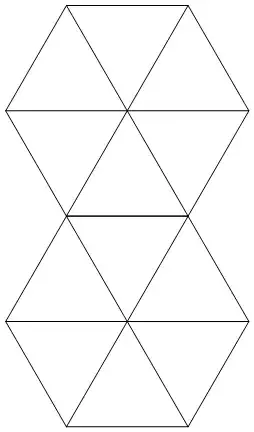
Something like these at the simplest case:


Consider the image below:
GraphData[{"Wheel", 7}]
Is it possible in Mathematica to lay several of these Graph along each other and then get the coordinates of the resultant network?
Something like these at the simplest case:
You can get the vertex coordinates, e.g.
g = GraphData[{"Wheel", 7}]
vc=PropertyValue[g, VertexCoordinates]
yielding:
{{-0.5, -0.866}, {0.5, -0.866}, {1., 0.}, {0.5, 0.866}, {-0.5,
  0.866}, {-1., 0.}, {0., 0.}}
UPDATE
To do the other objects (without the overlaid lines):
grap = GraphicsComplex[vc, Line /@ List @@@ EdgeList[g]];
tr[p_] := GeometricTransformation[grap, TranslationTransform[p]]
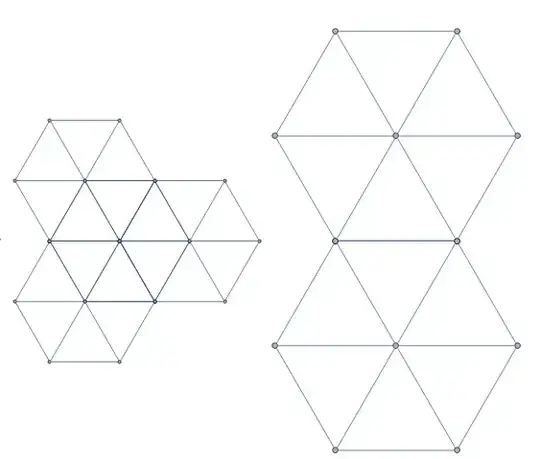
First object:
gr1 = Graphics[{grap,
   tr[{1, 0}], tr[{-1/2, -Sin[Pi/3]}], tr[{-1/2, Sin[Pi/3]}]}]

Second object:
gr2 = Graphics[{grap, tr[{0, 2 Sin[Pi/3]}]}]
Update 3: A one-liner
ClearAll[f];
f[g_, tr : {{_, _} ..}, opts : OptionsPattern[]] :=
             Graphics[Translate[First@Show@g, {{0, 0}, ## & @@ tr}], opts]

g = GraphData[{"Wheel", 7}];
tr1 = {{1, 0}, {-1/2, -Sin[Pi/3]}, {-1/2, Sin[Pi/3]}};
tr2 = {{0, 2 Sin[Pi/3]}};
Row[f[g, #, ImageSize -> 300] & /@ {tr1, tr2}]
Update 2: The simplest approach to convert a Graph g to Graphics turns out to be Show[g] (see this answer by becko -- thanks: @MarkMcClure). So, with translations* defined in previous update:
g = GraphData[{"Wheel", 7}];
g4 = First@Show[g];
g4a = Graphics[Translate[g4, #] & /@ translations1b, ImageSize -> 300];
g4b = Graphics[Translate[g4, #] & /@ translations2b, ImageSize -> 300];
Row[{g4a, g4b}]
(* same pictures as above *)
Update: slightly more streamlined version using Translate and GraphComputation`GraphConvertToGraphics:
g = GraphData[{"Wheel", 7}];
g2 = First@GraphComputation`GraphConvertToGraphics[g];
translations1 = {{1, 0}, {-1/2, -Sin[Pi/3]}, {-1/2, Sin[Pi/3]}};
translations2 = {{0, 2 Sin[Pi/3]}};
translations1b = Prepend[translations1, {{0, 0}}];
translations2b = Prepend[translations2, {{0, 0}}];


g3a = Graphics[Translate[g2, #] & /@ translations1b, ImageSize -> 300];
g3b = Graphics[Translate[g2, #] & /@ translations2b, ImageSize -> 300];
Row[{g3a, g3b}]
(* same pictures as above *)
Original post:
Borrowing the function tr from @ubdqn's excellent answer, and using the undocumented function GraphComputation`GraphConvertToGraphics:
tr2[g_, p_] := GeometricTransformation[g, TranslationTransform[p]];
g2 = First@GraphComputation`GraphConvertToGraphics[g];

g2a = Graphics[{g2, tr2[g2, #] & /@ translations1}, ImageSize -> 300];
g2b = Graphics[{g2, tr2[g2, #] & /@ translations2}, ImageSize -> 300];
Row[{g2a, g2b}]
(* same pictures as above *)
GraphConvertToGraphics function is called byShowwhen applied to aGraph. Thus,Show[g]` accomplishes the same thing.
– Mark McClure
Aug 19 '14 at 14:26
GraphConvert thing before but more recently learned of the more intuitive approach with Show.
– Mark McClure
Aug 19 '14 at 14:34
GraphData: theVertexCoordinatesare only given as approximate real numbers, so that the coordinates that you can extract from theGraphicsare not the exact geometric values. Basically, I think the information inGraphDatais limited to the number of digits that can be visually discerned in a graph display, so you shouldn't use them for high-precision calculations. Not sure why they didn't implement exact values here... – Jens Aug 19 '14 at 23:18