I would like to map my data on Archimedes' spiral and preserve the distance between points on the curve.
The test data consists of 20 evenly spaced {x,y} coordinates:
data = Table[{i, i}, {i, 20}]
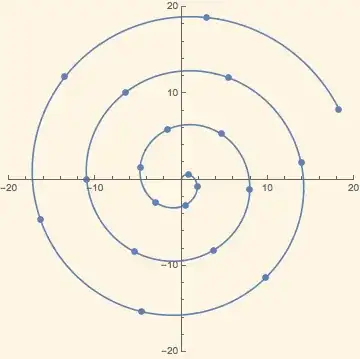
When I map the data to a spiral, the points are not evenly spaced anymore:
Show[ListPlot[{#[[2]] Sin[#[[1]]], #[[2]] Cos[#[[1]]]} & /@ data,
  AspectRatio -> 1, PlotRange -> {{-20, 20}, {-20, 20}}],
 ParametricPlot[{t Sin[t], t Cos[t]}, {t, 0, 20}]]
I found this question that links to the algorithm that iteratively generates evenly distributed points on a spiral, but how can I apply this to my set of data points?
The final goal that I'm trying to achieve is to create a function that I can use with ImageTransformation that will remap an image that roughly resembles a line to an Archimedes' spiral.


datatoSqrt[2 #] & /@ Table[{i, i}, {i, Range[0, 1/2 20^2, 1/2 20]}]or similar ? – b.gates.you.know.what Aug 19 '14 at 12:05