8

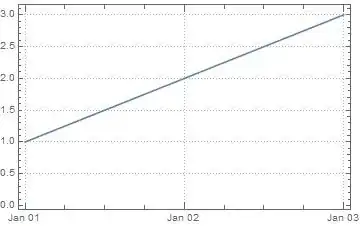
This doesn't work...

DateListPlot[{{DateObject[{2014, 1, 1}], 1}, 
{DateObject[{2014, 1, 2}], 2}, 
{DateObject[{2014, 1, 3}], 3}}, 
 Joined -> True, GridLines -> {{DateObject[{2014, 1, 2}]}, None}]

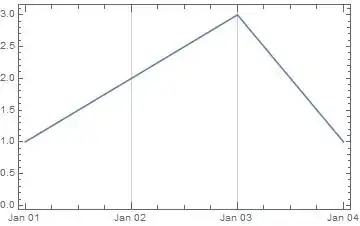
Neither does this...

DateListPlot[{{DateObject[{2014,1,1}],1},
{DateObject[{2014,1,2}],2},
{DateObject[{2014,1,3}],3}}, 
Joined->True, PlotRange->{{DateObject[{2014,1,1}],DateObject[{2014,1,3}]},All}]

Converting the values in GridLines and PlotRange to DateLists works.

It seems a bit of an over-sight not to support DateObject here.

The question is should this work?

Ymareth
  • 4,741
  • 20
  • 28
  • Is there a question to be answered here? Perhaps you could ask a Q and post your answer. (Others might come up with different answers, too.) – Michael E2 Aug 19 '14 at 15:24
  • Removing DateObject[] completeley works too – hieron Aug 19 '14 at 15:48
  • @hieron - Agreed but since DateObject is a new feature and is supported as part of the data series I'm wondering if its non-support in terms of values for GridLines and PlotRange is a bug or I am doing something wrong. – Ymareth Aug 19 '14 at 15:53

1 Answers1

3

Some possibilities to plot GridLines with DateListPlot:

DateListPlot[{
  {{2014, 1, 1}, 1},
  {{2014, 1, 2}, 2},
  {{2014, 1, 3}, 3}},
 PlotTheme -> "Detailed"]

enter image description here

DateListPlot[{
  {{2014, 1, 1}, 1},
  {{2014, 1, 2}, 2},
  {{2014, 1, 3}, 3},
  {{2014, 1, 4}, 1}},
 GridLines -> {{{{2014, 1, 2}, Red}, {"Jan 3, 2014", Green}}, Automatic}]

enter image description here

DateListPlot[{
  {{2014, 1, 1}, 1},
  {{2014, 1, 2}, 2},
  {{2014, 1, 3}, 3},
  {{2014, 1, 4}, 1}},
 GridLines -> {DateRange["Jan 2, 2014", "Jan 3, 2014"], None}]

enter image description here

PlotRange

DateListPlot[Sqrt[Range[10]], {2007, 4, 10},
 PlotRange -> {{{2007, 4, 11}, {2007, 4, 17}}, Automatic},
 FrameTicks -> {{Automatic, Automatic}, {{"April 11, 2007", "April 17, 2007"}, Automatic}}]

enter image description here

eldo
  • 67,911
  • 5
  • 60
  • 168
  • I agree these work and I can work around the issue but my question is more "is this a bug?". Thank you for the time and effort and attention. PlotTheme is new to me so I have learnt something too :). – Ymareth Aug 19 '14 at 16:25
  • @Ymareth It's not a bug - The only thing you have to do is to remove DateObject: GridLines -> {{{2014, 1, 2}}, None} – eldo Aug 19 '14 at 16:34
  • 4
    I looks like a bug. Would you, as a hypothetical Mathematica developer, extend DateListPlot to accept DateObject as x-coordinate values and deliberately avoid their use as values for GridLines and PlotRange? A bug of omission and one easily worked around but it still looks like a bug to me. – Ymareth Aug 19 '14 at 16:46
  • @Ymareth I was myself surprised that GridLines doesn't accept DateObjects. "Bug of omission" is a nice definition :) – eldo Aug 19 '14 at 17:04