4

I use the following command to export plots to PDF which I then use in latex:

plot = Plot[x^2, {x, -2, 2}, AxesLabel -> {x, x^2}, 
       PlotLegends -> {"Function f(x) = x^2"}]
Export[NotebookDirectory[] <> "SimplePlot.pdf", plot]

enter image description here

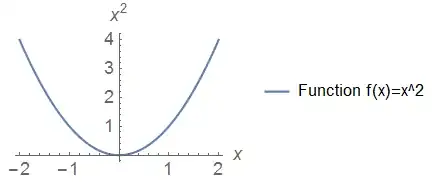
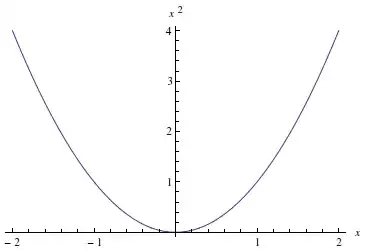
Now the "problem" is that the font of $x$, $x^2$ and $f(x)=x^2$ is not at all similar to the standard font of latex. I found that the command TraditionalForm produces output with a font that seems to fit latex much better:

enter image description here

But simply putting AxesLabel -> {TraditionalForm[x], TraditionalForm[x^2]} for example does not change the plot's font. So how can I change the font in my plot to the one that TraditionalForm offers? And no, I do not want to change the font in latex. ;)

Dr. belisarius
  • 115,881
  • 13
  • 203
  • 453
Phil-ZXX
  • 461
  • 4
  • 12
  • The url's for your images don't have public access – Dr. belisarius Sep 03 '14 at 16:05
  • That's twice the same link ... – Dr. belisarius Sep 03 '14 at 16:13
  • My location has blocked uploads on SE, so I had to use google. The direct links to the images are https://docs.google.com/file/d/0B8kIki5yrvFbZnREdVg0TlZPeTQ/edit?pli=1 and https://docs.google.com/file/d/0B8kIki5yrvFbYTNGajBadDVWU0k/edit?pli=1. I am very sorry about the inconvenience. – Phil-ZXX Sep 03 '14 at 16:15
  • Does PlotTheme->"ItalicLabels" give something close to what you need? – kglr Sep 03 '14 at 16:51
  • @wuyingddg solution works as expected on 10.0 for Mac OS X x86 (64-bit) (June 29, 2014). If you like to change the plot's font you can add LabelStyle -> {FontFamily -> "Times", 14, GrayLevel[0]}. As long as the Font is installed on your System, the Font will be embedded. –  Sep 03 '14 at 16:58
  • @kguler It is almost perfect. But it literally makes everything italic (even the ticks on the axes), so a 1 looks (alomost) like a 7. Is there any way of specifying which part of the plot is made italic and which not? – Phil-ZXX Sep 03 '14 at 16:59
  • @Lou Your tip worked. And plot=Plot[x^2,{x,-2,2},AxesLabel->{x,x^2},PlotLegends->{Style["Function f(x) = x^2",Italic]},LabelStyle->{FontFamily->"Times",14,GrayLevel[0]}] gives the desired result (on Win7, 64 Bit, Mathematica 10.0). – Phil-ZXX Sep 03 '14 at 17:02
  • Tom, add the option TicksStyle -> Plain.. – kglr Sep 03 '14 at 17:16
  • @kguler It works! Thanks a lot. But how does one learn all these little details ...? – Phil-ZXX Sep 03 '14 at 17:24
  • @Tom, v10 added quite a few of these little details:) this Q/A may be useful. – kglr Sep 03 '14 at 17:37

3 Answers3

4
plot = Plot[x^2, {x, -2, 2},  AxesLabel -> {Style[x, 20], Style[x^2, 20]}, 
     PlotTheme->"ItalicLabels",TicksStyle->Plain,
     PlotLegends -> {Row[{Style["Function  ",20,FontSlant-> "Plain",FontFamily->"Times"], 
        Style[HoldForm[ f[x]  =   x^2],20,FontSlant->"Oblique",FontFamily->"Times"]}] }]

enter image description here

Or, instead of using PlotTheme->"ItalicLabels" you can directly use the option settings for LabelStyle and TickStyle as follows

plot = Plot[x^2, {x, -2, 2},   AxesLabel -> {x,  x^2},
    LabelStyle (* or BaseStyle *) ->
          Directive[FontFamily->Times,FontSlant->"Oblique",FontSize->20],
    TicksStyle->Directive[FontSize->14,FontSlant->Plain],
    PlotLegends -> {Row[{Style["Function  ",FontSlant-> "Plain",FontFamily->"Times"], 
        Style[HoldForm[ f[x]  =   x^2],FontSlant->"Oblique",FontFamily->"Times"]}] }]

to get the same picture as above.

To get the settings for the theme "ItalicLabels" use

Charting`ResolvePlotTheme["ItalicLabels", Plot]

enter image description here

See also: this Q/A and this one

kglr
  • 394,356
  • 18
  • 477
  • 896
  • If we write Plot[x^2,{x,-2,2},AxesLabel->{Style[x,20],Style[x^2,20]},PlotLegends->{Style[HoldForm[Function f[x]=x^2],20]},LabelStyle->{FontFamily->"Times"}], then = is not tilted. – Phil-ZXX Sep 03 '14 at 17:52
  • @Tom, it seems that we need to also add FontSlant->"Oblique"... – kglr Sep 03 '14 at 17:58
  • This is just nitpicking, but why do you add Oblique? This is exactly what makes the equal sign = crooked, which one would probably want to avoid. – Phil-ZXX Sep 03 '14 at 18:27
  • Oh ... I thought you wanted the = sign look slanted:) – kglr Sep 03 '14 at 18:41
2

Mathematica 9 use TraditionalForm by default

Plot[x^2, {x, -2, 2}, AxesLabel -> {x, x^2}]

enter image description here

Mathematica 10 also use TraditionalForm, but fonts are different. So we have to change fonts back

Plot[x^2, {x, -2, 2}, AxesLabel -> {x, x^2}, AxesStyle -> FontFamily -> "Times"]

enter image description here

ybeltukov
  • 43,673
  • 5
  • 108
  • 212
1

The function Style and HoldForm may be helpful

plot = Plot[x^2, {x, -2, 2}, 
  AxesLabel -> {Style[x, 20, " TraditionalForm"], 
    Style[x^2, 20, " TraditionalForm"]}, 
  PlotLegends -> {HoldForm[Function f[x] = x^2] // TraditionalForm}]

f(x) should be f[x] so that it can be convert into TraditionalForm

enter image description here

wuyingddg
  • 1,943
  • 10
  • 14
  • This only seems to work in Mathematica 9, but I am using version 10, in which your example (unfortunately) gives the same output as my screenshot above. :/ – Phil-ZXX Sep 03 '14 at 16:38