I would like to accurately distort this plot of $\sin(x^{1/2})$ (and others like it) so that the wavelengths are evened out (ie - "inverse-square root" it).

I should like to do the same to "de-log" plots too.
I have no idea where to start though.
plt1 = Plot[Sin[Sqrt[x]], {x, 0, 1000}, ImageSize -> 400];

ticks = Ticks /. AbsoluteOptions[plt1, Ticks];
ticks = MapAt[#^(1/2) &, ticks, {{1, All, 1}}];
plotrange = PlotRange[plt1];
plotrange = MapAt[#^(1/2) &, plotrange, {1}];

plt2 = Graphics[plt1[[1]] /. Line[x_] :> Line[{#[[1]]^(1/2), #[[2]]} & /@ x],
                PlotRange -> plotrange, Ticks -> ticks, plt1[[2]]];
Row[{plt1, plt2}]

Update: The approach above works without issue in Version 9.0.1.0 (Windows 8 64bit). Unfortunately it does not work in Version 10 because AbsoluteOptions stopped working as expected in Version 10. A work-around until the AbsoluteOptions glitch is fixed (hopefully in Version 10.0.1.0) is to specify the ticks directly:
ticksb = {{#^(1/2),#}&/@FindDivisions[{0,1000},{5}][[1]],Automatic};
plt2b = Graphics[plt1[[1]] /. Line[x_] :> Line[{#[[1]]^(1/2), #[[2]]} & /@ x],
            PlotRange -> plotrange, Ticks -> ticksb, plt1[[2]]];
Row[{plt1, plt2b}]

Axes::axes: {{False,False},{False,False}} is not a valid axis specification. >>`` Axes::axes: {{False,False},{False,False}} is not a valid axis specification. >>`` Ticks::ticks: {Automatic,Automatic} is not a valid tick specification. >>`` Ticks::ticks: {Automatic,Automatic} is not a valid tick specification. >>`` Axes::axes: {{False,False},{False,False}} is not a valid axis specification. >>`` General::stop: Further output of Axes::axes will be suppressed during this calculation. >>
– martin
Sep 14 '14 at 08:35
AbsoluteOptions stopped working es expected in Version 10. I will try to find a workaround to handle the ticks. (The rest of the code works if you you comment out the parts involving ticks)
– kglr
Sep 14 '14 at 10:05
#^(1/2) with Log[#]. Am I missing something?
– martin
Sep 14 '14 at 11:50
Log[0] (Indeterminate) in ticksb and plotrange is the source of the problem. You can either (1) change the range {0,1000} to {1,1000} or (2) use ticksb /. Indeterminate->0 instead of ticksb and similarly for plotrange.
– kglr
Sep 14 '14 at 14:09
Here is an attempt to do this using the internal options used by LogPlot etc. It has the advantage of correctly working with the adaptive sampling of Plot to produce a better result with extreme scaling.
SetAttributes[scaledPlot, HoldRest]

scaledPlot[scfn_, exp_, {s_, r1_, r2_}, arg___] :=
 With[{inv = InverseFunction[scfn]},
   Plot[exp, {s, scfn[r1], scfn[r2]}, arg,
     Method -> {"MappingFunctions" -> {{#1, #2} &, {#1, #2} &},
                "DomainMappingFunctions" -> {inv}},
     Ticks -> {Charting`ScaledTicks[{scfn, inv}], Automatic}
   ]
 ]
Examples:
scaledPlot[Sqrt, Sin[x^(1/2)], {x, 0, 1000}]

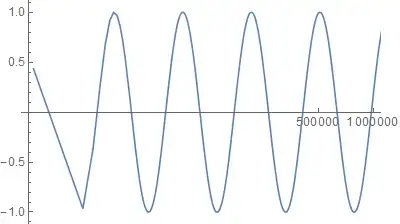
scaledPlot[#^(1/4) &, Sin[x^(1/4)], {x, 0, 2*^6}]

Compare the second result with the same plot using kguler's method and the value of adaptive sampling becomes apparent:
plt1 = Plot[Sin[x^(1/4)], {x, 0, 2*^6}, ImageSize -> 400];
ticksb = {{#^(1/4), #} & /@ FindDivisions[{0, 2*^6}, {5}][[1]], Automatic};
plt2b = Graphics[plt1[[1]] /. Line[x_] :> Line[{#[[1]]^(1/4), #[[2]]} & /@ x],
  PlotRange -> plotrange, Ticks -> ticksb, plt1[[2]]]
The more extreme the scaling the worse this problem will become, and adding PlotPoints will not overcome it. (e.g. try x^(1/9))
Note: Sometimes the tick marks disappear, e.g. with #^(1/3) &. This seems like a problem with Charting`ScaledTicks but one can always specify a list of ticks manually if necessary.
ListLinePlot, but since you wouldn't get adaptive sampling there anyway a manual scaling approach seems reasonable.
– Mr.Wizard
Sep 14 '14 at 14:25
Based on your last comment and if I understand it correctly, you want to work with the image itself. If so, maybe something like this would help.
img = Plot[Sin[Sqrt[x]], {x, 0, 1000}];

 ImageTransformation[img, {#[[1]]^2, #[[2]]} &]
sin(x^2)should be zero at the origin. – Shredderroy Sep 14 '14 at 01:54Sin[Sqrt[x]] /. x -> x^2/1000. Another, if you want to "morph" the graphs would be(1 - t) Sqrt[x] + t x / Sqrt[1000], fortrunning from 0 to 1. That's assumingxranges from0to1000. – Michael E2 Sep 14 '14 at 02:45