I am facing an issue when trying to use Show command to show multiple graphs within one graph. Show command only shows red dot from one of the graph.
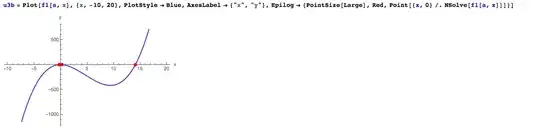
u3b = Plot[f1[a, x], {x, -10, 20}, PlotStyle -> Blue,
  AxesLabel -> {"x", "y"},
  Epilog -> {PointSize[Large], Red,
    Point[{x, 0} /. NSolve[f1[a, x]]]}]
dydx = D[x^3 - a x^2 - x + 1, x];

Plot[dydx, {x, -10, 20}, PlotStyle -> Blue, AxesLabel -> {"x", "y"}]
u3c = Plot[dydx, {x, -10, 20}, PlotRange -> Automatic,
  PlotStyle -> Blue, AxesLabel -> {"x", "y"},
  Epilog -> {PointSize[Large], Red, Point[{x, 0} /. NSolve[dydx]]}]

Show[u3b, u3c, PlotRange -> Automatic]


Showwill use the options of the first argument and thus drop the second occurence ofEpilog. You need to add those graphics primitives once more. – Yves Klett Sep 19 '14 at 11:48